Precision Trading with the RSI Main Indicator: A Comprehensive Guide
The Relative Strength Index (RSI) has long been the gold standard for technical analysts seeking to measure the speed and change of price movements. In the fast-paced world of 2026 financial markets, the RSI Main Indicator stands out as an essential tool for identifying overbought or oversold conditions, helping traders navigate volatility with confidence and precision.
The Mechanics of Momentum
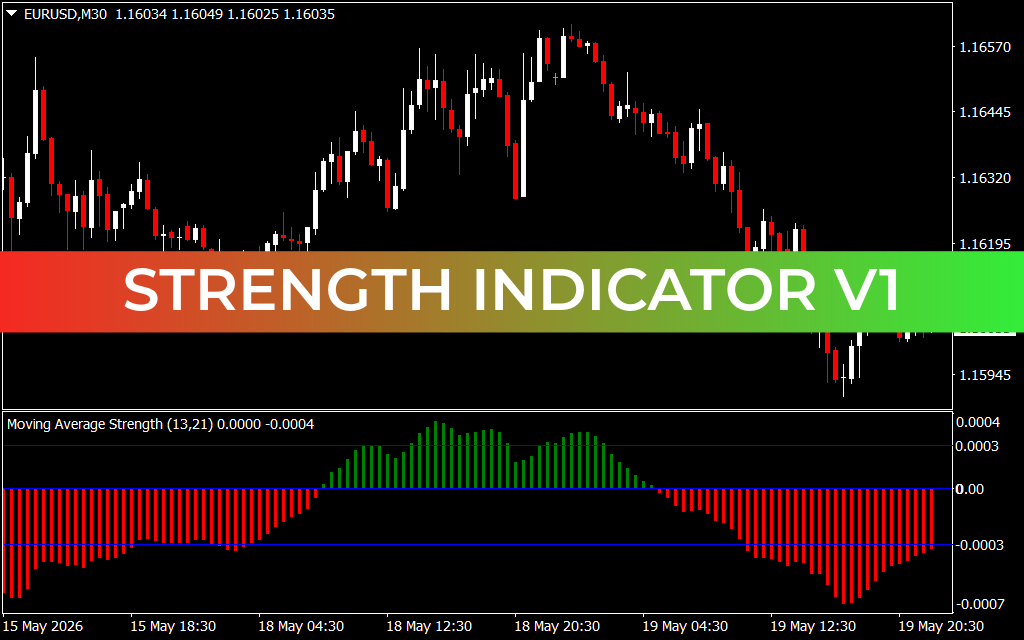
At its core, the RSI is a momentum oscillator that ranges from 0 to 100. Traditionally, an RSI reading above 70 indicates that an asset may be overbought, suggesting a potential pullback or reversal. Conversely, a reading below 30 suggests the asset is oversold, signaling a possible buying opportunity.
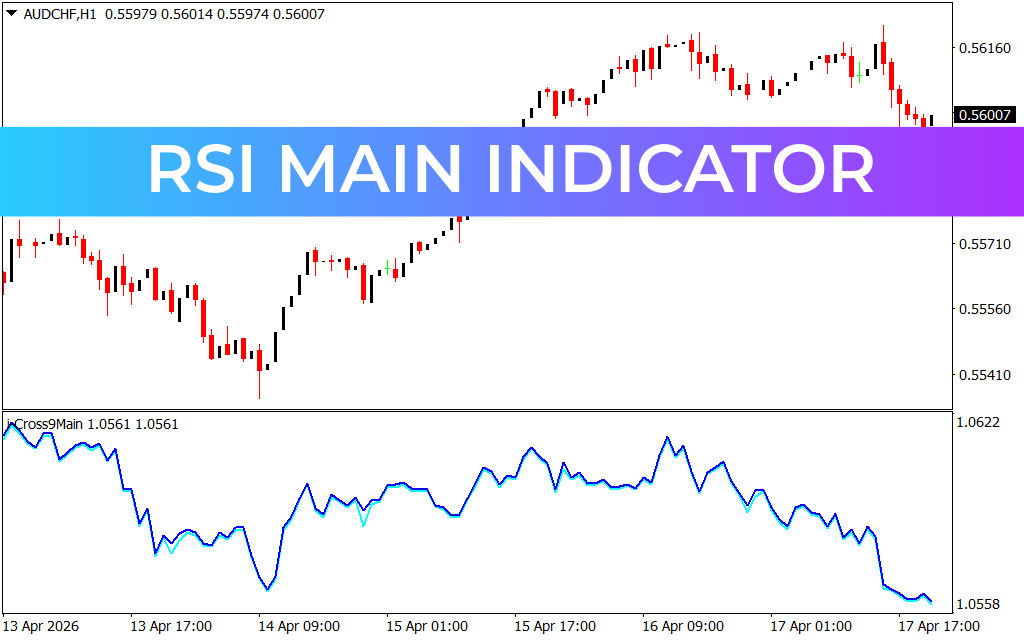
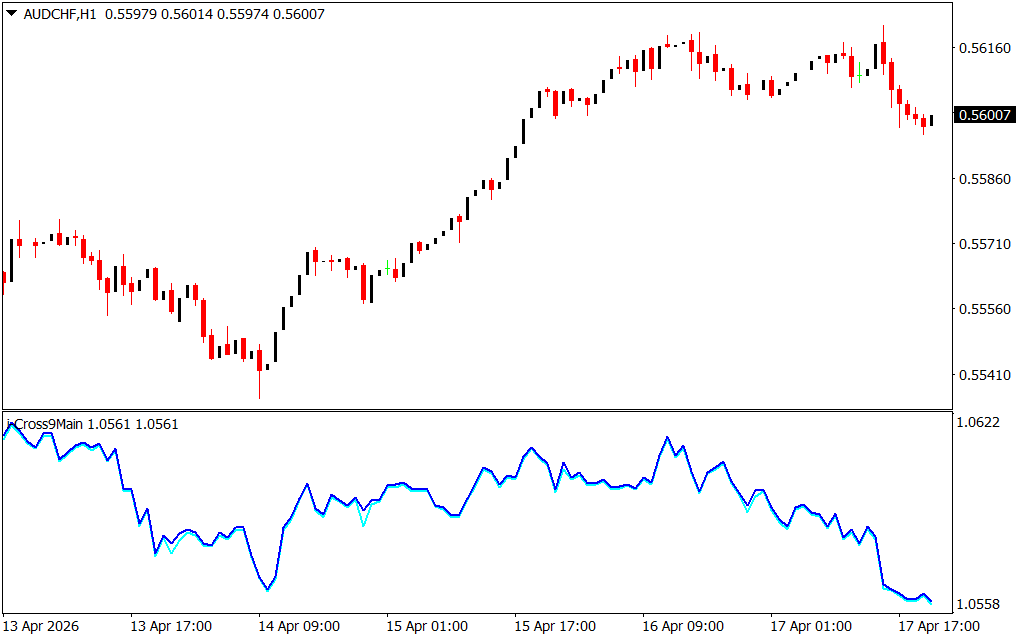
What sets the RSI Main Indicator apart is its visual clarity. By plotting these momentum shifts directly beneath your Price Action—as seen in the AUD/CHF 1-hour chart—traders can immediately spot the exhaustion of a trend before it reflects in the candlesticks.
Spotting High-Probability Reversals
While the 70/30 levels are the baseline, the most advanced traders use the RSI Main Indicator to identify Divergence. Divergence occurs when the price action makes a new high, but the RSI fails to follow suit, making a lower high. This discrepancy is often the "canary in the coal mine," warning that the prevailing trend is losing steam.
- Bullish Divergence: Price hits a new low, but RSI hits a higher low. This indicates selling pressure is fading.
- Bearish Divergence: Price hits a new high, but RSI hits a lower high. This indicates buying momentum is drying up.
Optimized for Clean Trading Interfaces
Modern trading requires focus. The RSI Main Indicator is designed for high-contrast environments, providing sharp, blue-line visuals that cut through market noise. Whether you are trading major forex pairs like AUD/CHF or volatile crypto assets, having a clean, lag-free momentum oscillator is the difference between chasing a move and anticipating one.
Integrating RSI into Your Strategy
No indicator should be used in isolation. The RSI Main Indicator performs best when combined with price action analysis, such as Support And Resistance levels or candlestick patterns. For instance, an RSI "oversold" signal carries significantly more weight when it occurs at a major historical support zone.
By downloading and installing the RSI Main Indicator, you are equipping your trading station with a professional-grade tool built for the modern era. It simplifies complex market data into an actionable visual format, allowing you to trade with logic rather than emotion.
1 Download
Last Update:
Apr 19, 2026 21:03 PM
Published:
Feb 04, 2026 02:14 AM
Category: