Maximize Market Precision with the Rsi Ma Label Indicator
In the world of technical analysis, the Relative Strength Index (RSI) is a staple for identifying overbought and oversold conditions. However, raw RSI data can sometimes be erratic, leading to "head fakes" or premature entries. The Rsi Ma Label indicator for MetaTrader 4 is a professional-grade solution that combines momentum with trend-smoothing technology, providing a much clearer picture of market strength.
What is the Rsi Ma Label Indicator?
The Rsi Ma Label is a dual-layered oscillator that plots a standard RSI line alongside a Moving Average (MA) of that RSI data. By applying a moving average to the RSI itself, the indicator filters out market noise and helps traders identify the true underlying momentum of Price Action.
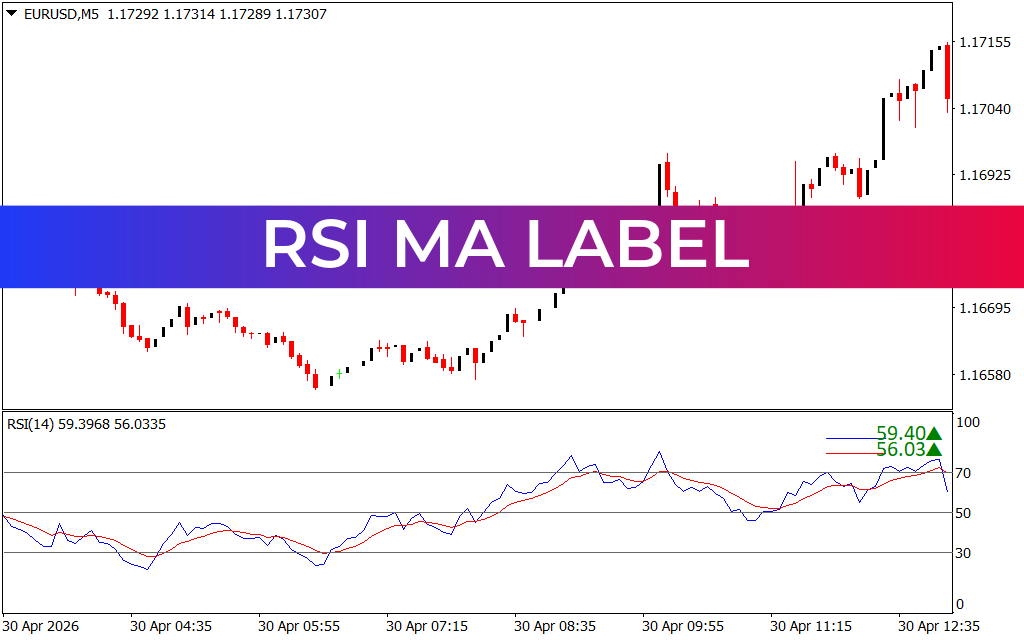
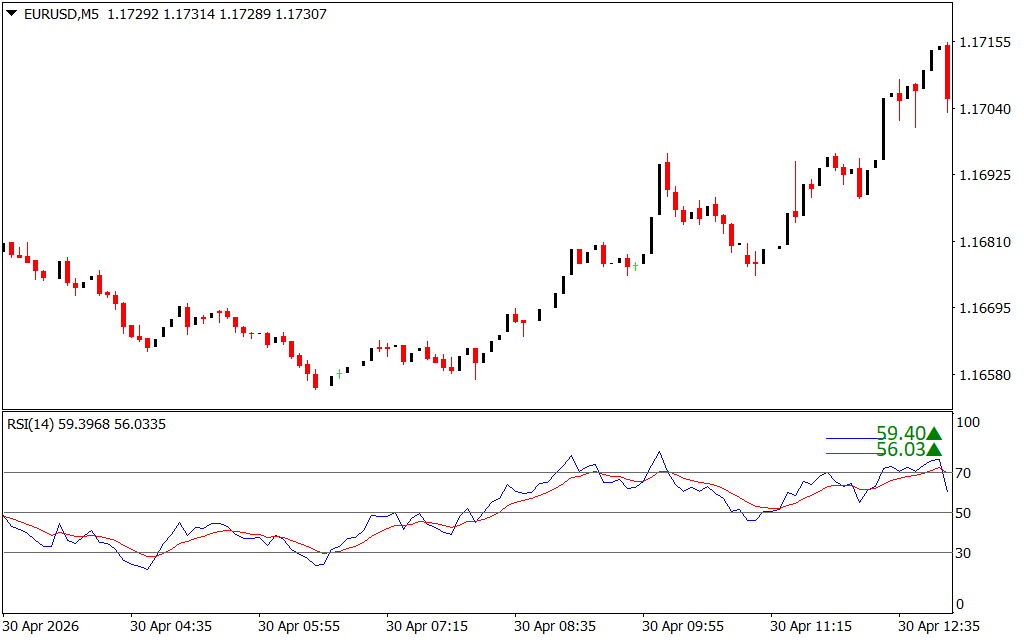
As seen in the provided chart, the indicator appears in a separate sub-window:
- Blue Line: Represents the fast-acting RSI momentum.
- Red Line: Represents the smoothed Moving Average of the RSI.
- Visual Labels: Displays real-time numerical values with directional arrows (green/red) to indicate current momentum strength at a glance.
Key Advantages of Rsi Ma Label
- Momentum Confluence: Instead of relying on a single line, you get instant confirmation. When the RSI (Blue) crosses above its MA (Red), it signals increasing bullish momentum. Conversely, a cross below signals bearish strength.
- Reduced False Signals: The red MA line acts as a filter. It prevents traders from chasing every minor tick in the RSI, ensuring you only pay attention to momentum shifts that have sustained weight behind them.
- Dynamic Overbought/Oversold Tracking: Traditional RSI uses static 70 and 30 levels. With Rsi Ma Label, you can observe how the momentum reacts relative to its average, providing a more nuanced view of market exhaustion.
- Real-Time Data Labels: The integrated labels in the right-hand corner of the sub-window mean you don't have to hover your mouse over the indicator to see exact values. This is critical for fast-paced scalping and precision day trading.
Strategic Trading with Rsi Ma Label
To get the most out of this tool, it is best utilized for Trend Continuation and Mean Reversion setups.
- The RSI Cross Strategy: A classic entry trigger occurs when the blue RSI line crosses the red MA line. In an uptrend, wait for the RSI to dip below the MA and then cross back above it for a high-probability "Buy" signal.
- 50-Level Crossover: The center line (50) represents market equilibrium. If both the RSI and its MA cross above the 50 level, it confirms that the bulls have taken control of the medium-term trend.
- Divergence Analysis: Use the Rsi Ma Label to spot price divergence. If the price makes a higher high but the RSI and its MA make a lower high, a significant Trend Reversal may be imminent.
Conclusion
The Rsi Ma Label indicator is an essential upgrade for any trader who values clarity and precision. By smoothing out standard momentum data and adding clear visual labels, it removes the guesswork from trend analysis. Whether you are trading Forex, commodities, or indices, the Rsi Ma Label provides the technical edge needed to navigate volatile markets with confidence.
3 Downloads
Last Update:
Apr 30, 2026 23:34 PM
Published:
Jan 30, 2026 03:02 AM
Category: