Master Market Momentum with the RSI Dots Indicator
Finding the perfect entry point in the fast-paced world of Forex and stock trading is often the difference between a winning streak and a blown account. While the standard Relative Strength Index (RSI) is a staple for many, the RSI Dots indicator takes this classic oscillator and transforms it into a visual powerhouse designed for modern chart layouts.
What is the RSI Dots Indicator?
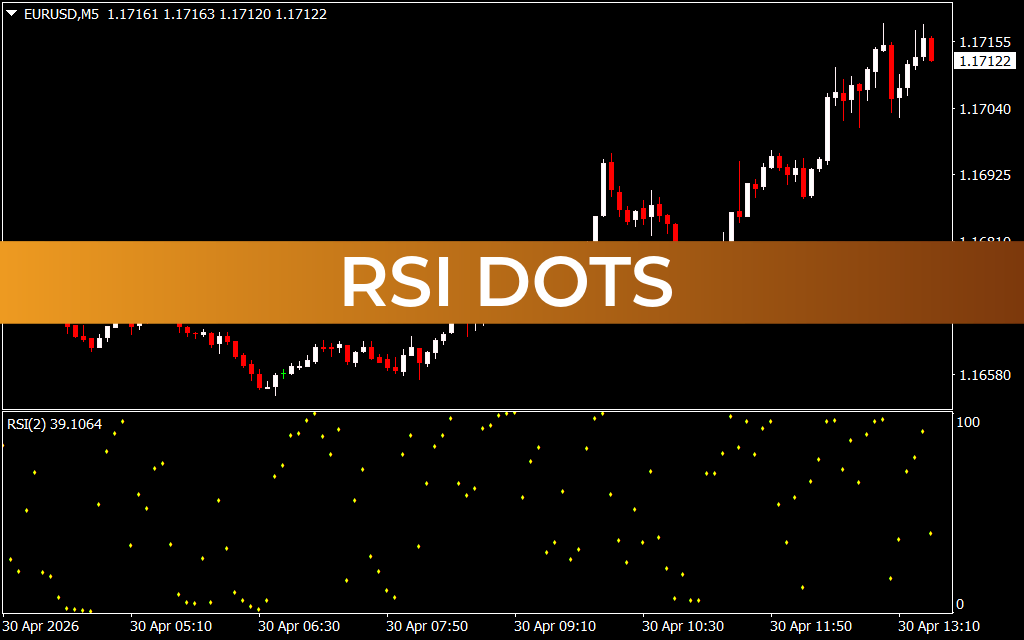
The RSI Dots indicator is a refined version of the traditional RSI oscillator. Instead of a continuous fluctuating line that can often clutter your sub-window, this version plots individual dots to represent the RSI value at each candle close. This minimalist approach allows traders to spot momentum shifts and overbought/oversold conditions with surgical precision without the visual "noise" of a jagged line.
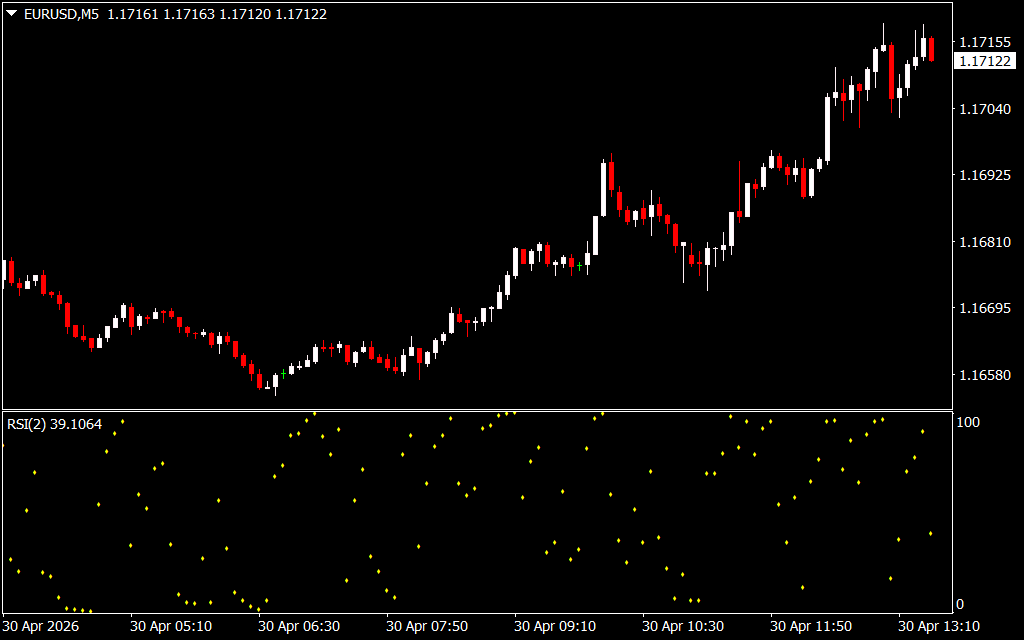
As seen in the EURUSD M5 chart, the RSI Dots (set to a period of 2) provides a high-frequency look at market sentiment. When dots cluster at the extremes—near the 0 or 100 levels—it signals that the market is stretched and a reversal or correction may be imminent.
Key Features and Benefits
- Clean Visual Interface: By using dots instead of lines, you get a clearer view of the specific RSI level for every single bar.
- Rapid Momentum Tracking: Using a low period (like RSI 2) helps scalp traders identify micro-trends and immediate exhaustion points.
- Overbought and Oversold Clarity: Easily identify when the market has hit "peak" levels. When dots hit the 100 ceiling or 0 floor, the probability of a price pivot increases significantly.
- Customizable Parameters: Like the traditional version, you can adjust the period and levels to fit your specific trading style, whether you are a day trader or a long-term investor.
Trading Strategies with RSI Dots
To get the most out of this tool, it is best used in conjunction with Price Action. Here are two ways to integrate it:
1. The Mean Reversion Strategy
Look for the RSI Dots to hit the oversold (0-10) or overbought (90-100) zones. Once a dot appears in these extremes, wait for a price action confirmation—such as a bullish or bearish engulfing candle—on the main chart to enter the trade.
2. Divergence Hunting
RSI Dots make spotting divergences incredibly easy. If the price makes a higher high, but the dots in the RSI window make a lower high, you are looking at a bearish divergence. This is a powerful signal that the current uptrend is losing steam and a sell-off might be coming.
Conclusion
The RSI Dots indicator is a must-have for traders who value clarity and speed. It strips away the unnecessary to focus on what matters: where momentum is heading right now. Whether you are Scalping the 5-minute charts or swing trading the daily, this tool provides the visual edge needed to stay ahead of the curve.
1 Download
Last Update:
Apr 30, 2026 16:33 PM
Published:
Jan 30, 2026 19:18 PM
Category: