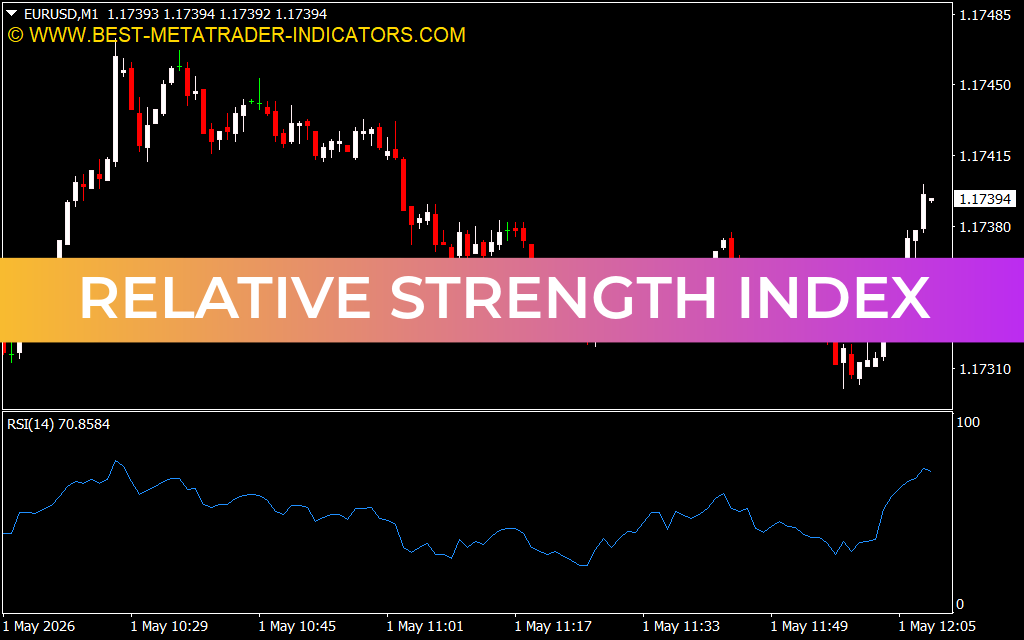
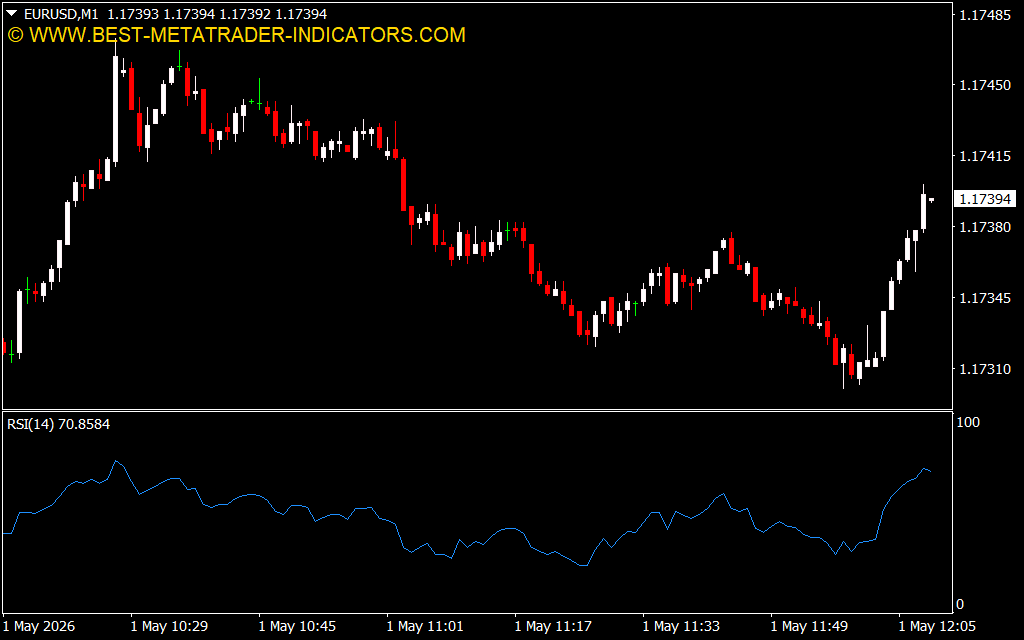
Master Market Momentum with the Relative Strength Index (RSI) for MT5
In the fast-moving environment of Forex trading, identifying when a currency pair is "overbought" or "oversold" is a fundamental skill. The Relative Strength Index (RSI) is one of the most widely used momentum oscillators in technical analysis. Developed by J. Welles Wilder, this tool measures the speed and change of price movements to help traders spot potential trend reversals before they happen.
Understanding the RSI Mechanism
The RSI oscillates between 0 and 100. It effectively tracks the magnitude of recent price gains against recent price losses. By providing a normalized view of momentum, the indicator reveals when a market is stretched too far in one direction.
- Overbought (Above 70): When the RSI crosses above 70, it suggests that the asset may be overvalued and due for a pullback or reversal.
- Oversold (Below 30): When the RSI falls below 30, it indicates that the asset may be undervalued, signaling a potential opportunity for the price to bounce back up.
Why RSI is Essential for Your Trading Toolkit
For traders using MetaTrader 5, the RSI is more than just a line on a chart; it is a high-level filter that prevents you from entering trades at dangerous extremes.
- Divergence Signals: One of the most powerful features of the RSI is identifying divergence. When the price creates a new high but the RSI fails to follow suit, it signals that the trend is losing steam. This is often the first warning sign that a major reversal is imminent.
- Trend Confirmation: During a strong trend, the RSI often holds between 40 and 60. Traders frequently use these levels to confirm that a trend is healthy and still has room to run, helping them hold their winning positions longer.
- Objective Entry Points: Instead of relying on guesswork, the RSI provides objective, data-driven zones. By waiting for an RSI "re-entry" signal—where the indicator pulls back from extreme levels and moves back toward the center—traders can time their entries with higher precision.
- Multi-Timeframe Versatility: Whether you are an intraday scalper on the M1 chart or a swing trader analyzing the Daily timeframe, the RSI provides consistent signals across all market cycles.
Strategic Implementation
The most successful traders do not trade the RSI in isolation. They use it as a "confirmation tool." For example, if your strategy identifies a support level, check the RSI. If the RSI is simultaneously in the "oversold" zone (below 30) and showing signs of curling upward, the probability of a successful trade increases significantly.
Conclusion
The RSI is a timeless indicator because it focuses on the internal strength of the market rather than just the price itself. By adding the Relative Strength Index to your MT5 workspace, you gain a professional-grade tool to manage risk and spot trend exhaustion. Download the RSI indicator today and bring a new level of momentum-based intelligence to your trading strategy.
1 Download
Last Update:
May 01, 2026 15:10 PM
Published:
Jan 29, 2026 18:43 PM
Category: