Master Market Structure with the QSI Lag Range Indicator for MT4
In the fast-paced world of Forex trading, one of the greatest challenges for any technical analyst is distinguishing between a genuine trend expansion and a temporary price fluctuation. Most standard indicators suffer from excessive "lag," providing signals only after the most profitable part of the move has passed. The QSI Lag Range Indicator for MetaTrader 4 is a revolutionary tool designed to minimize this delay, providing a high-definition view of market volatility and range transitions in real-time.
The Science of Reduced Lag and Range Detection
The "QSI" methodology is built upon a proprietary smoothing algorithm that prioritizes recent Price Action over historical data, significantly reducing the "drag" found in traditional moving averages or oscillators. By focusing on the Lag Range, the indicator identifies the specific price boundaries where institutional orders are most likely clustered.
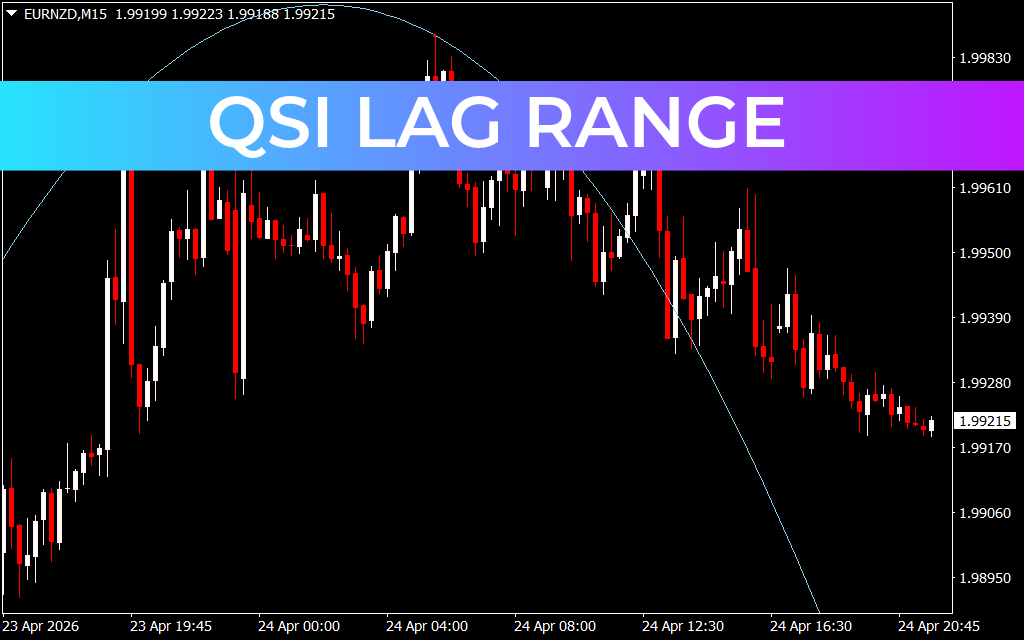
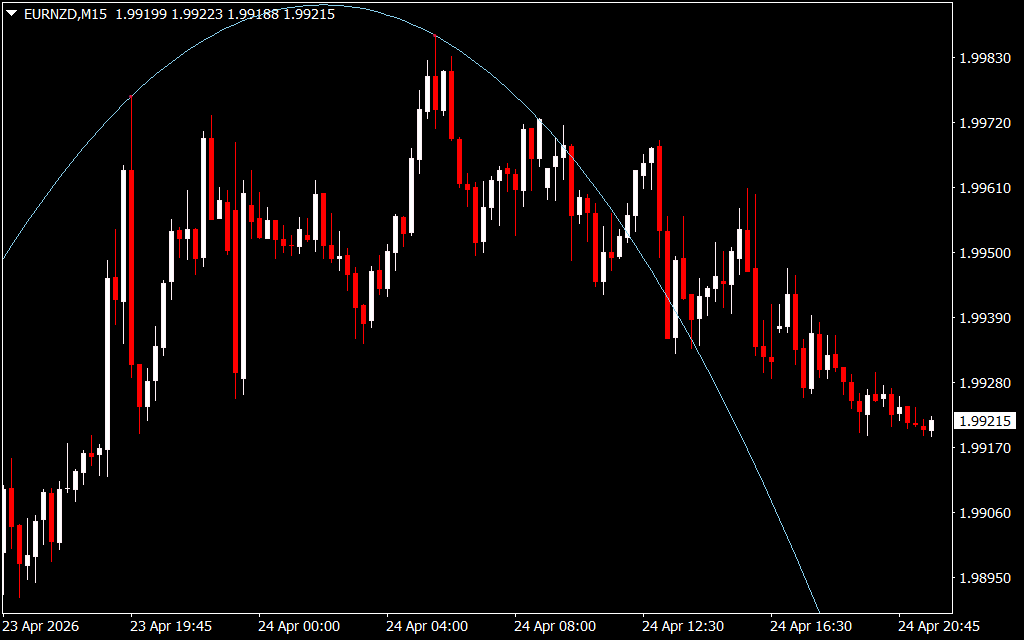
As demonstrated in the recent EURNZD H1 price action on April 13, 2026, the QSI Lag Range creates a dynamic "channel" or "envelope" around the price.
- The Upper Range Boundary (Purple): Acts as a dynamic resistance zone. When price tests this level and produces a reversal arrow, it signals a high-probability shorting opportunity.
- The Lower Range Boundary (Blue): Functions as a dynamic support floor. Bounce signals at this level indicate that buyers are stepping in to defend the current range.
- The Median Line (Yellow): Represents the market's equilibrium point. Trading above the median suggests a bullish bias, while trading below it maintains a bearish outlook.
Surgical Precision on the Hourly Timeframe
Trading volatile pairs like EURNZD requires an indicator that can handle sharp spikes without losing its structural integrity. In the provided H1 chart, the QSI Lag Range successfully mapped the massive bearish expansion that occurred between April 7 and April 9. While the market crashed from 2.02925 toward 1.99430, the indicator provided several "Impulse Arrows"—magenta down-arrows for sells and cyan up-arrows for buys—that allowed traders to scale into the trend with confidence.
The beauty of the QSI Lag Range is its ability to identify Mean Reversion setups. When the price deviates significantly from the yellow median line and touches the outer blue or purple boundaries, the statistical probability of a return to the mean increases. This allows scalpers and swing traders alike to catch the "meat" of the move before the market stabilizes.
Why Every Professional MT4 Trader Needs QSI Lag Range
The QSI Lag Range Indicator is designed for clarity. It removes the guesswork from technical analysis by providing objective visual markers for entry and exit. Its core benefits include:
- Trend-Following Accuracy: Stay on the right side of the market by following the slope of the dynamic range.
- Volatility Adaptation: The range expands and contracts automatically based on market energy, ensuring your stops and targets are always relevant.
- Visual Alert System: The inclusion of signal arrows means you never have to miss a critical price action setup again.
Stop trading with lagging data that leaves you one step behind the market makers. Upgrade your MT4 platform with the QSI Lag Range Indicator and start trading with the precision and speed of a professional.
1 Download
Last Update:
Apr 25, 2026 12:47 PM
Published:
Feb 03, 2026 01:35 AM
Category: