Maximizing Profits with the Parabolic SAR (PSAR) Indicator
In the world of Trend Following, the Parabolic SAR (Stop and Reverse) stands out as one of the most visually intuitive and effective tools ever created. Developed by J. Welles Wilder Jr., the same mind behind the RSI and ATR, the PSAR is specifically designed to help traders identify the prevailing trend and, more importantly, determine the exact moment a trend has reached its conclusion.
Understanding the Parabolic SAR
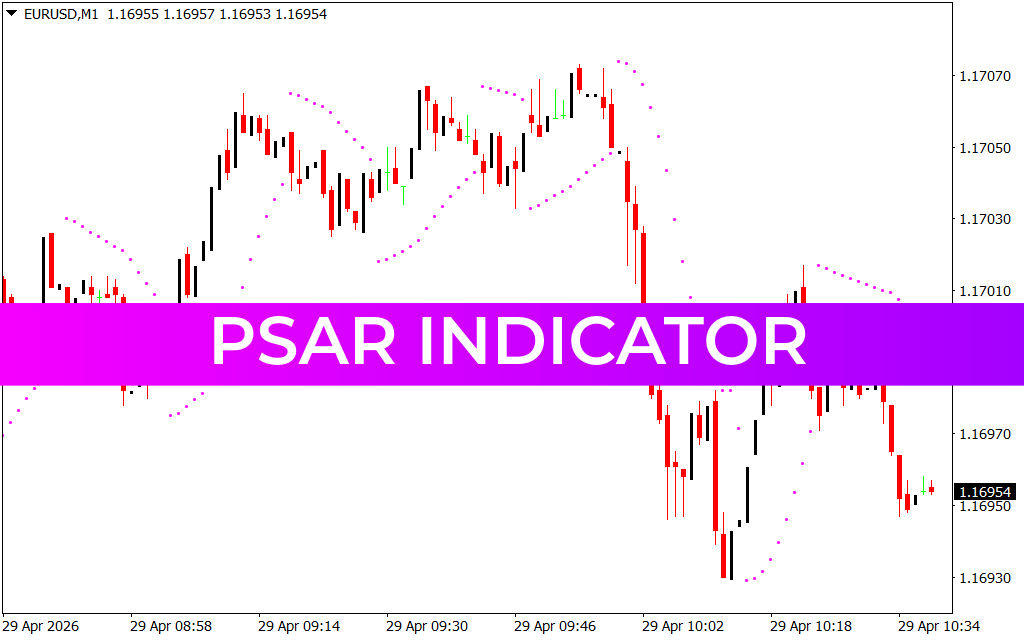
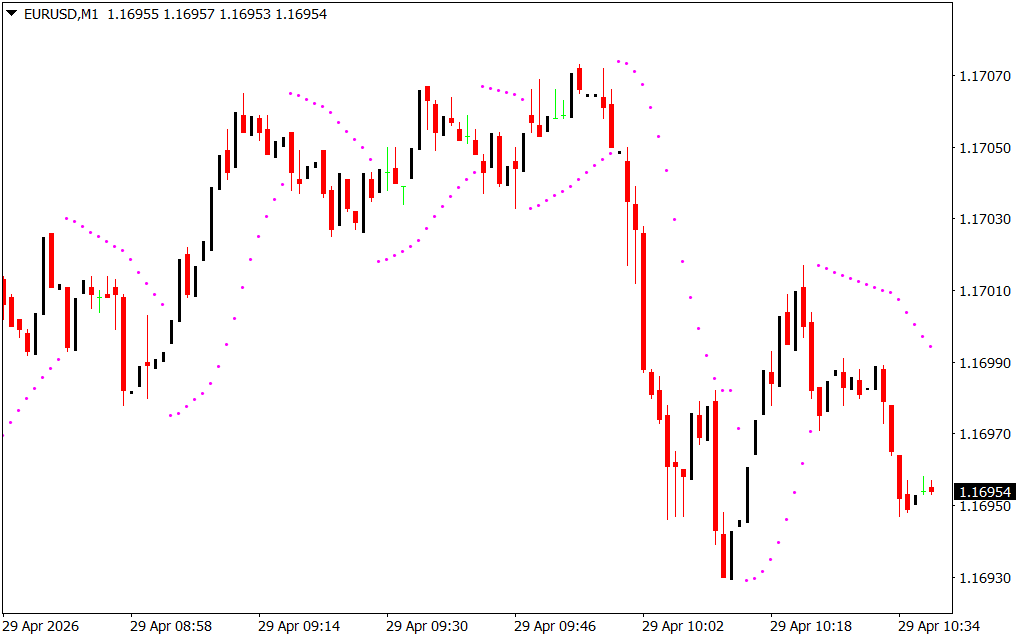
The "SAR" in the name stands for Stop and Reverse. Unlike many indicators that focus solely on price levels, the PSAR incorporates the element of time. It appears on your chart as a series of small dots placed either above or below the price candles.
- Bullish Signal: When the dots are located below the price, the market is in an upward trend.
- Bearish Signal: When the dots are located above the price, the market is in a downward trend.
As a trend accelerates, the dots move closer to the price. This "parabolic" movement creates a trailing stop-loss that automatically tightens as the trade moves in your favor, helping you lock in profits while giving the trend room to breathe.
The Mechanics of the PSAR
The indicator uses an Acceleration Factor (AF) that increases every time the price reaches a new high (in an uptrend) or a new low (in a downtrend). This means that if a trend does not continue to make progress, the SAR dots will eventually catch up to the price, triggering a "Stop and Reverse" signal. This makes it an exceptional tool for exiting trades before a correction wipes out your gains.
How to Trade with the Parabolic SAR
The PSAR is highly versatile and can be used in several ways to enhance your strategy:
- Trend Confirmation: Use the PSAR to confirm the direction of the market. If you are looking for buy opportunities, ensure the dots are below the candles.
- Trailing Stop-Loss: This is the most popular use of the indicator. By moving your stop-loss to the level of the most recent PSAR dot, you create a dynamic exit strategy that evolves with market volatility.
- Entry Signals: A "flip"—where the dots move from above the price to below—indicates a potential change in trend and can be used as an entry trigger.
Best Practices and Limitations
While the Parabolic SAR is a powerhouse in trending markets, it can provide false signals in sideways or "choppy" markets. To maximize its effectiveness, it is best paired with other indicators like the Average Directional Index (ADX) to confirm the strength of the trend before entering. On shorter timeframes like the M1 or M15, the PSAR is excellent for scalpers looking to ride quick momentum bursts with tight risk management.
Conclusion
The Parabolic SAR is a foundational tool for any technical trader. Its unique combination of price and time analysis provides a clear, objective way to stay on the right side of the market. By mastering the "flip," you can transform your approach to risk management and trend following.
1 Download
Last Update:
Apr 29, 2026 13:40 PM
Published:
Jan 31, 2026 02:36 AM
Category: