Master Trend Explosions with Parabolic SAR Histogram Arrow Alerts
In the rapid-fire environment of day trading, clarity is your greatest asset. While the classic Parabolic SAR (Stop and Reverse) is a legendary tool for identifying trend direction, its standard "dots" can sometimes clutter a chart or lead to late entries during high volatility. The Parabolic SAR Histogram Arrow Alerts system solves this by transforming traditional Price Action logic into a streamlined, dual-confirmation powerhouse. By combining on-chart directional arrows with a high-visibility sub-window histogram, this indicator ensures you never miss a significant shift in market momentum.
The Power of Dual-Layer Confirmation
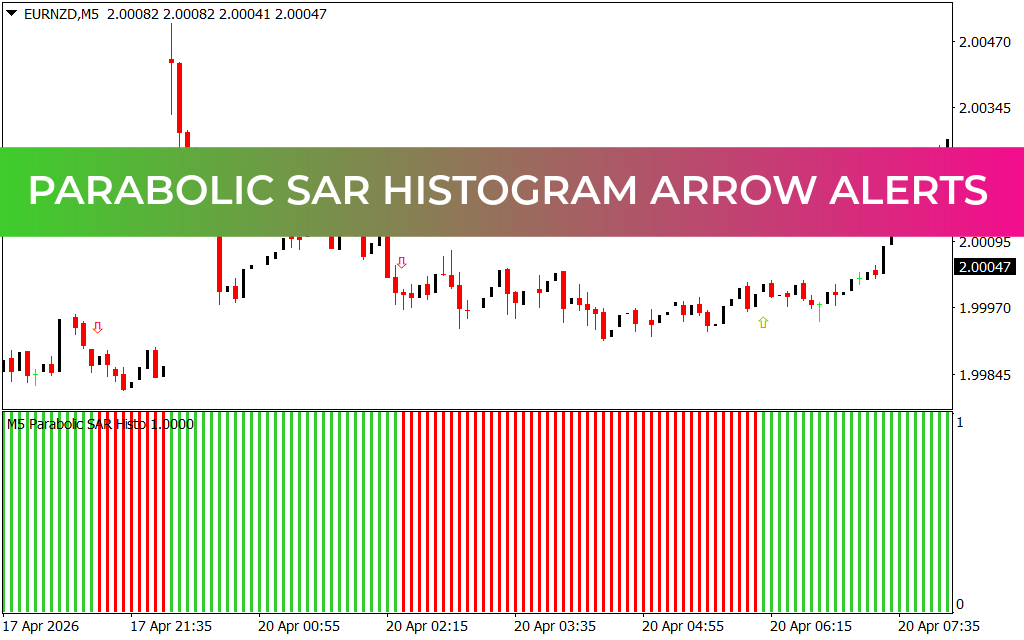
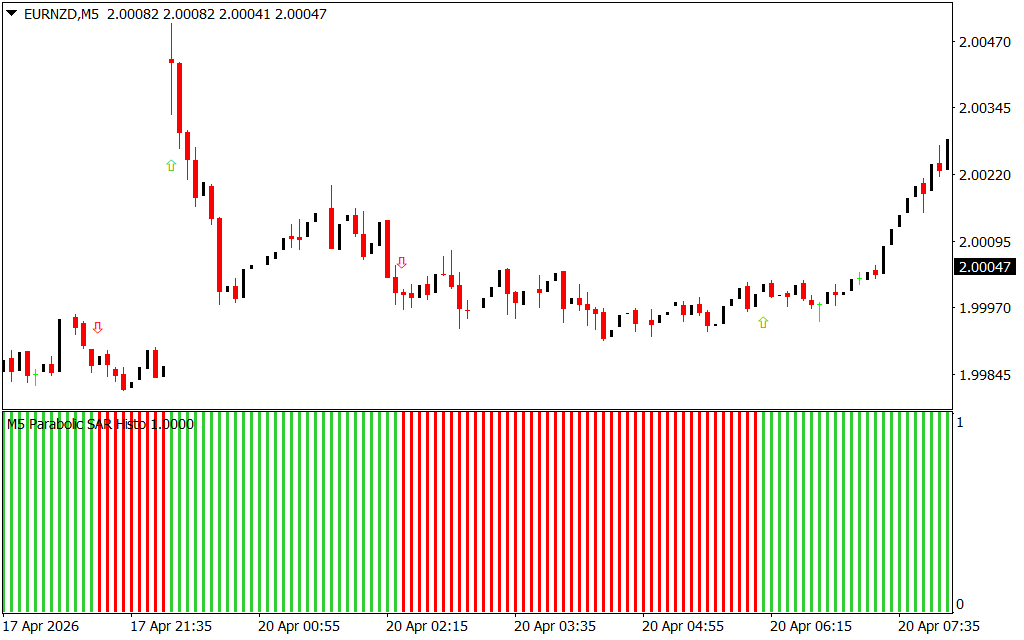
The genius of this system lies in its two-stage alert process. As seen on the EURNZD M5 chart, the indicator removes the guesswork by providing two distinct visual cues:
- On-Chart Arrow Alerts: Precision-timed green (up) and red (down) arrows appear the moment a Trend Reversal is confirmed. These arrows are calibrated to filter out minor market "breathing" and only trigger when a legitimate shift in momentum is detected.
- The Trend Histogram: Located in the bottom pane, the histogram acts as the "engine room" of the indicator.
- Solid Green Bars: Confirm a robust bullish trend, signaling that it is safe to maintain or enter long positions.
- Solid Red Bars: Confirm bearish dominance, providing a clear visual mandate to focus on sell opportunities.
Strategic Execution on the M5 and M15 Timeframes
For traders targeting currency pairs like EURNZD, the 5-minute and 15-minute timeframes offer the perfect balance of frequency and reliability. The Parabolic SAR Histogram Arrow Alerts system excels here by acting as a Volatility Filter.
- The "Zero-Lag" Entry: When an on-chart green arrow aligns with a fresh green histogram bar, you have a high-probability "Long" setup. This alignment indicates that both price action and underlying momentum are in sync.
- Dynamic Profit Taking: Unlike static take-profit levels, this system allows you to ride a trend until the histogram shifts color. This "trailing" approach ensures you capture the maximum number of pips during extended trending runs.
- Risk Management: The most recent arrow or histogram shift serves as an objective level for stop-loss placement, protecting your capital from sudden "whipsaws."
Why This Indicator is Essential for Your MetaTrader Setup
Most retail traders fail because they "over-trade" during sideways or ranging markets. The Parabolic SAR Histogram Arrow Alerts system is specifically designed to keep you on the sidelines during low-volatility periods and put you in the market the second a breakout occurs.
By separating the trend analysis into a dedicated sub-window, your main chart remains clean for additional price action analysis, such as identifying Support And Resistance levels. Whether you are a scalper looking for quick gains or a trend follower aiming for larger moves, this system provides the surgical precision and visual clarity needed to dominate the modern Forex markets.
1 Download
Last Update:
Apr 20, 2026 21:33 PM
Published:
Feb 03, 2026 16:51 PM
Category: