Master Volatility with the OHLC Range Indicator for MT4
In the world of intraday trading, understanding the statistical boundaries of price movement is just as important as predicting direction. Every trading session has a unique "personality" defined by its range—the distance between the highest and lowest price reached. The OHLC Range indicator for MetaTrader 4 (MT4) is a professional-grade utility designed to quantify this volatility in real-time, giving traders a clear mathematical edge when setting targets and managing risk.
What is the OHLC Range Indicator?
The OHLC Range indicator is an on-chart information tool that calculates the vertical distance between key price points: the Open, High, Low, and Close. While standard Price Action shows you where the market is, the OHLC Range tells you how much "room" the market has left to move based on historical and current session dynamics.
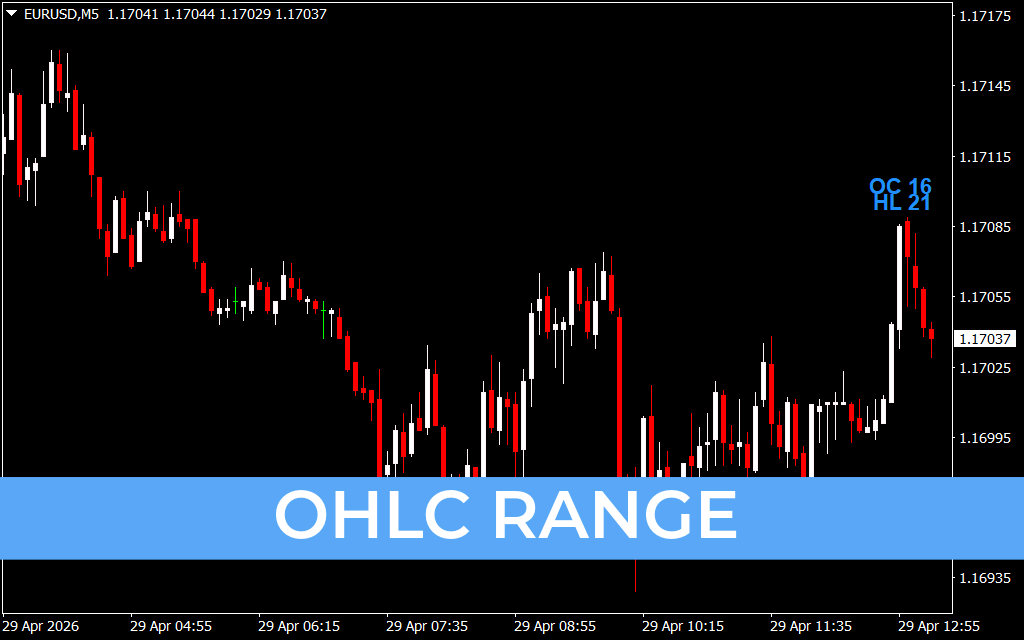
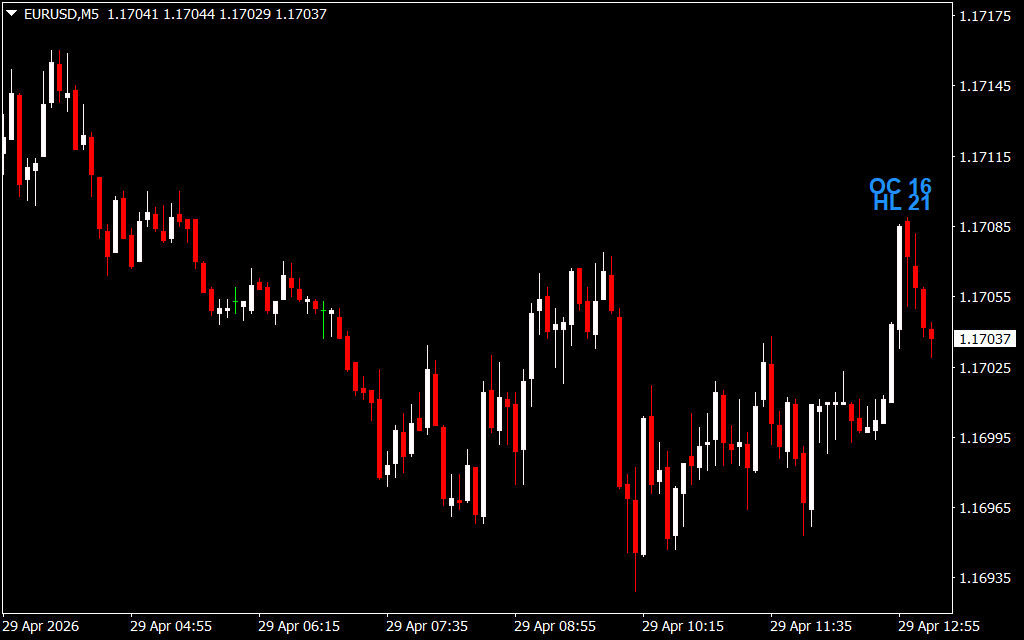
As seen on the EUR/USD M5 chart, the indicator provides a clean, unobtrusive text overlay in the corner of the screen. It typically displays two critical values: OC (the range between the Open and the current Close) and HL (the total range between the session High and Low). This data allows traders to see at a glance whether the market is in a state of compression or expansion.
Why Range Analysis Matters
Most retail traders fail because they enter trades when a move is already exhausted. The OHLC Range helps you avoid this common pitfall:
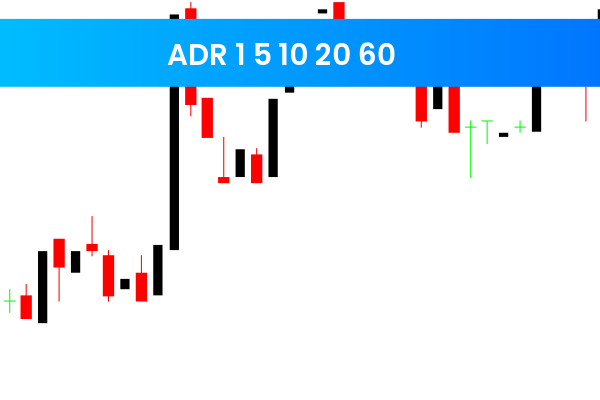
- Volatility Tracking: By seeing the current HL range (e.g., "21 pips"), you can compare it against the pair's Average Daily Range (ADR). If a pair usually moves 80 pips and has only moved 20, there is likely significant movement still to come.
- Objective Profit Targets: Use the current range data to set realistic Take Profit levels. If the HL range is hitting historical extremes for that specific time of day, it may be time to tighten stops.
- Identifying Breakouts: A very small OC (Open-to-Close) range often precedes a massive volatility spike. This "coiling" effect is a primary signal for breakout traders looking to capture the start of a new trend.
Strategic Trading Applications
The OHLC Range indicator is a versatile foundation for any technical strategy:
- The Range Extension Trade: If the market is trending strongly and the HL range is expanding, it confirms institutional participation. Traders can look for "pullback" entries as long as the range continues to make new session highs.
- Scalping Precision: On the M1 and M5 timeframes, the indicator helps scalpers identify "exhaustion pips." When the HL range hits a specific intraday threshold, the probability of a mean-reversion bounce increases significantly.
- Session Transition Analysis: Use the tool to track how the range changes from the Asian session into the London open. A sudden jump in the HL value is the first indicator of a session-driven trend shift.
Conclusion
The OHLC Range indicator is an essential utility for traders who prioritize data over guesswork. By transforming raw price action into actionable volatility statistics, it allows you to trade with a deeper understanding of market capacity. Whether you are a high-frequency scalper or a disciplined day trader, this tool provides the structural clarity needed to master price boundaries and execute trades with professional precision.
3 Downloads
Last Update:
Apr 29, 2026 16:17 PM
Published:
Jan 30, 2026 22:00 PM
Category: