Mastering Market Volatility with the Envelope Indicator
In the dynamic world of Forex trading, identifying the boundaries of Price Action is crucial for both breakout strategies and mean-reversion tactics. The Envelope Indicator is a foundational technical analysis tool that plots two moving averages around a central line, creating a "channel" that visually represents the expected range of price movement over a given period. By utilizing this indicator on platforms like MT4 and MT5, traders can effectively gauge market volatility and pinpoint potential overextended price levels.
What is the Envelope Indicator?
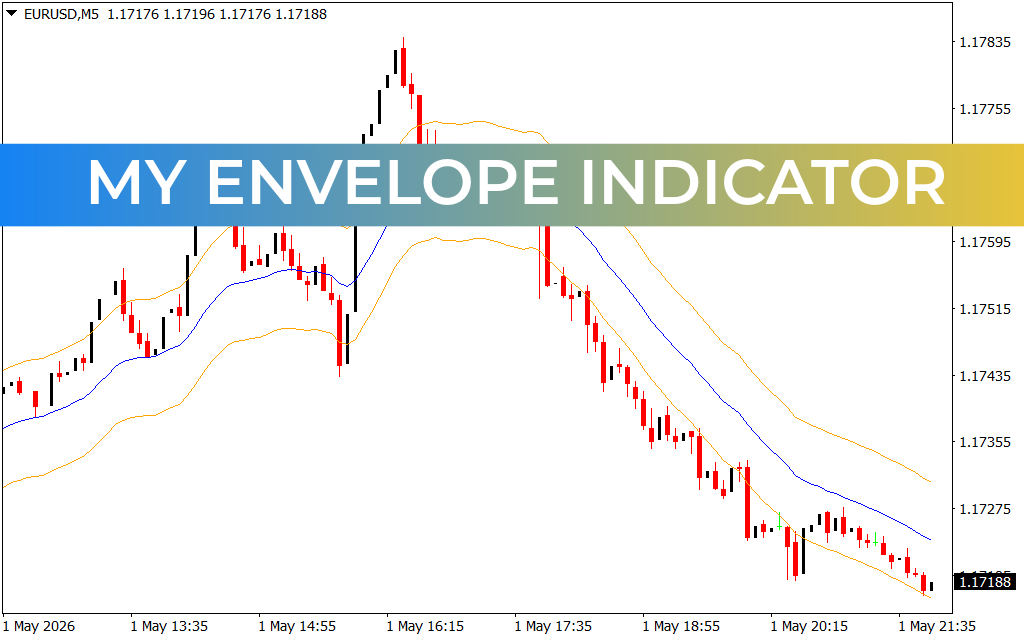
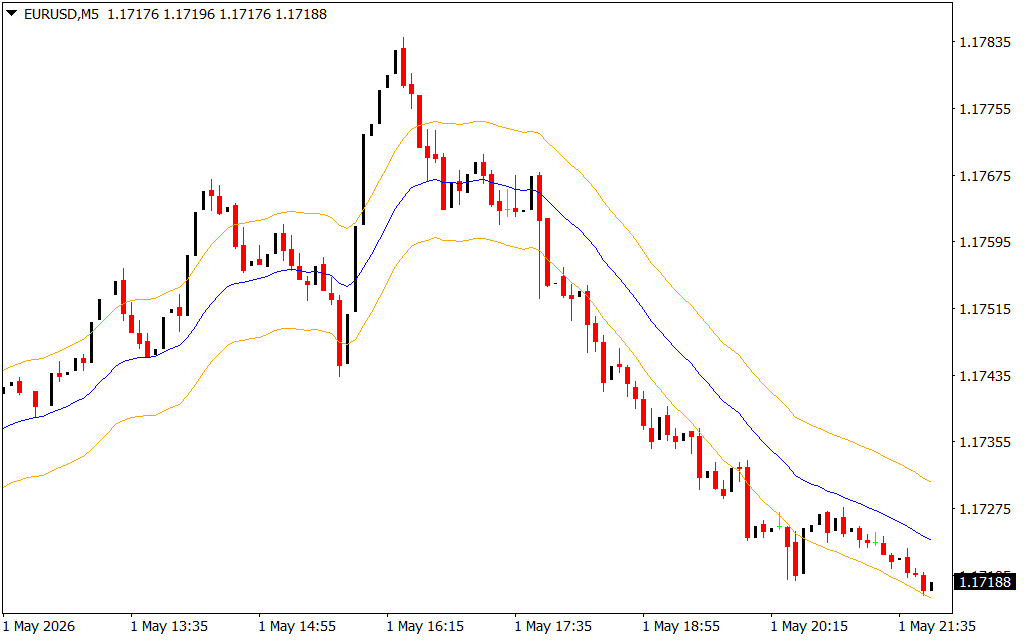
The Envelope Indicator is constructed using a central moving average (the "base" line) and two outer bands—one set at a fixed percentage above the base and another at a fixed percentage below it. As price fluctuates, these bands expand and contract, providing a clear visual representation of market volatility.
As shown in the EUR/USD M15 chart, when the market is stable, price tends to oscillate within the channel. When price touches or breaches the outer bands, it indicates that the asset may be overbought (hitting the upper band) or oversold (hitting the lower band), suggesting a possible corrective move back toward the central average.
Strategic Advantages of Envelope Trading
The Envelope Indicator is favored by traders for its simplicity and its ability to provide objective, data-driven entry and exit points:
- Mean Reversion: Many traders use the outer bands as contrarian signals. When price moves beyond the bands, it is often an indication that the move is overextended, and a "reversion to the mean" (the central line) is likely to occur.
- Breakout Identification: Conversely, a strong move that closes decisively outside the envelope can signal the start of a powerful new trend. In this scenario, the outer band that was previously acting as resistance or support becomes a key level to watch for price continuation.
- Volatility Analysis: The width of the envelope directly correlates to market volatility. When the bands are wide, it indicates high volatility; when they are narrow, the market is in a period of consolidation. This helps traders adjust their strategy to the current market environment.
- Visual Clarity: By removing the "noise" of individual candlestick spikes, the Envelope provides a clean structural view of the market, allowing traders to focus on the overall price trend rather than minor fluctuations.
Implementation and Best Practices
To get the most out of the Envelope Indicator, it is often combined with other confirmation tools. For example, waiting for price to touch the upper band while a momentum oscillator shows "overbought" conditions can provide a high-conviction "Sell" signal.
Furthermore, traders can use the bands as dynamic trailing stop-loss levels. By placing a stop just beyond the outer envelope band, you allow the trade room to develop while ensuring that a significant reversal against your position results in an exit before heavy losses occur. The Envelope Indicator is an essential component for any trader aiming to professionalize their approach and maintain a disciplined, objective trading strategy.
5 Downloads
Last Update:
May 02, 2026 22:23 PM
Published:
Jan 29, 2026 11:09 AM
Category: