Precision Trend Tracking: The Multi Line Moving Average Strategy
In the world of technical analysis, the moving average is often considered the "king of indicators." However, relying on a single line can often lead to lagging signals or premature exits. To truly understand market sentiment and Trend Strength, professional traders turn to the Multi Line Moving Average. This sophisticated approach uses multiple time-smoothed averages to create a comprehensive view of Price Action, helping you stay on the right side of the trade.
What is the Multi Line Moving Average?
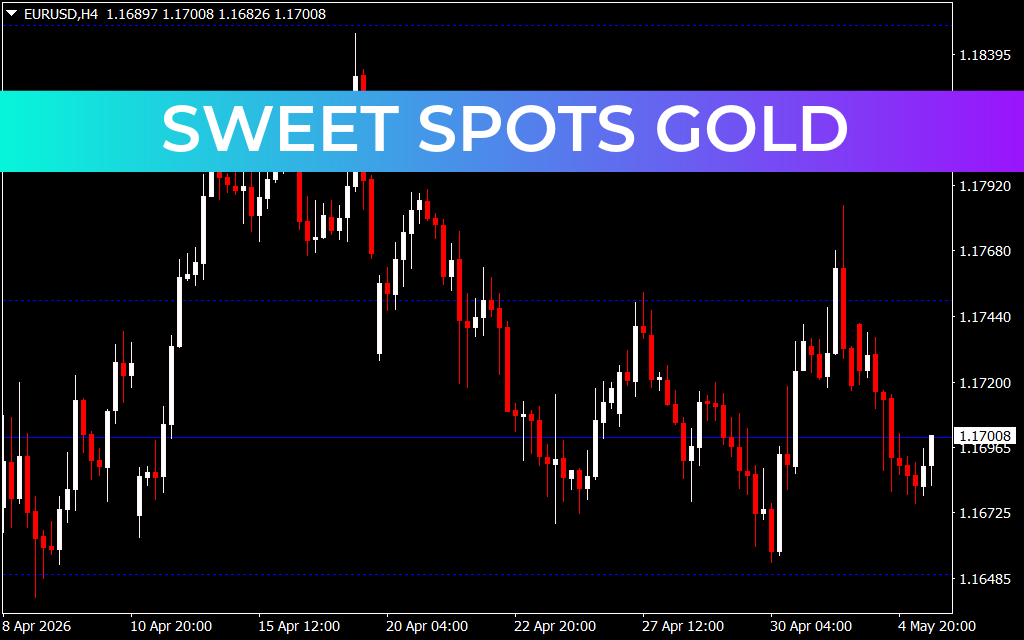
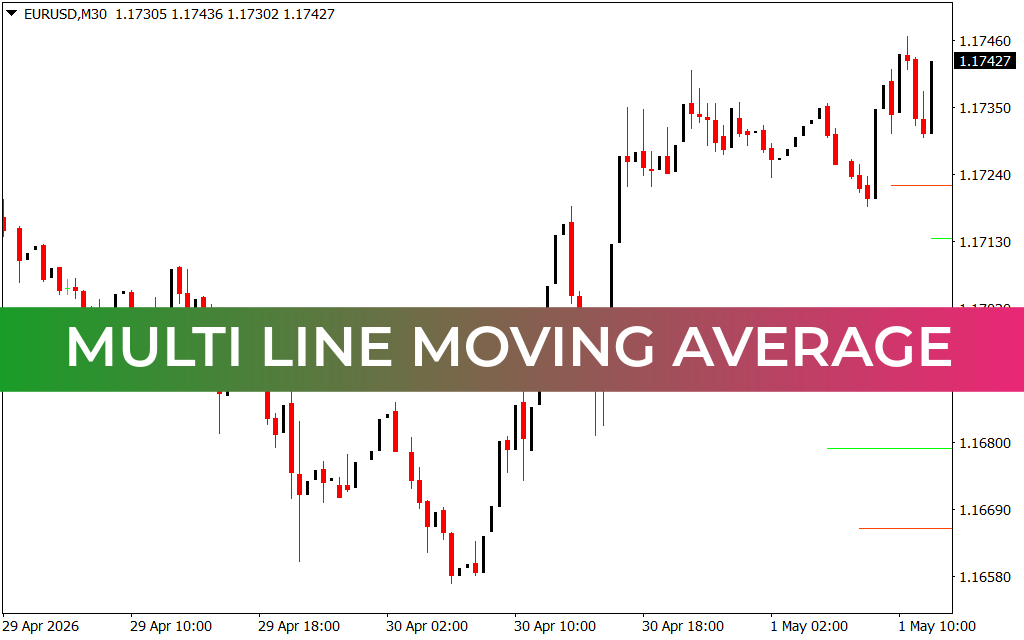
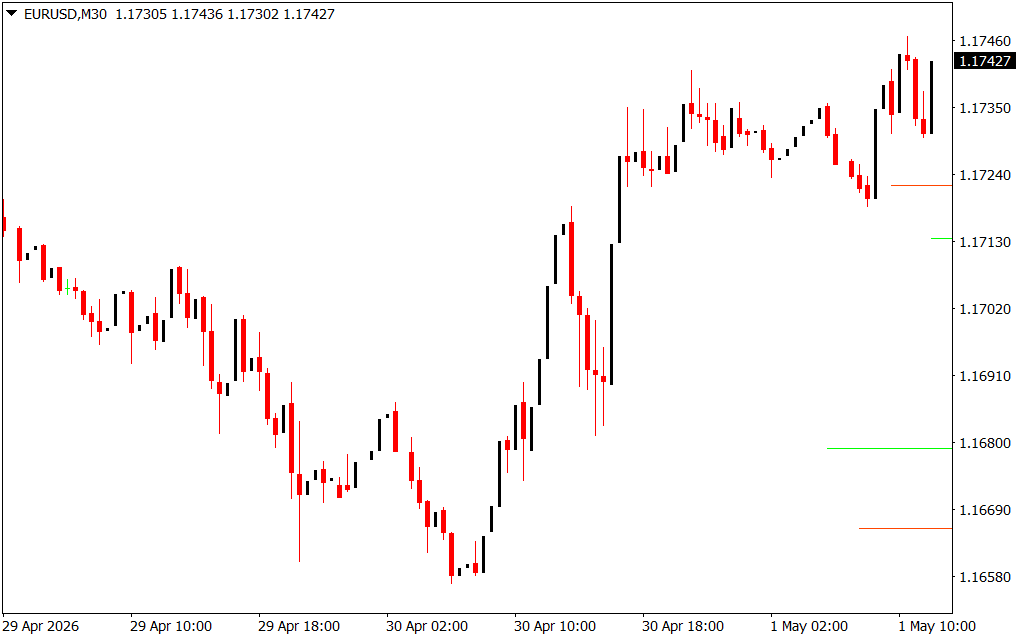
The Multi Line Moving Average indicator plots several moving averages—often varying in length and calculation method (Simple, Exponential, or Weighted)—on a single chart. As seen in the EUR/USD M30 chart, these lines act as a dynamic "web" or "ribbon" that tracks the price. When the lines are spread far apart, it indicates a strong, high-momentum trend. When they converge or "pinch," it signals a period of consolidation or an impending Trend Reversal.
On the M30 timeframe, this indicator is particularly powerful for intraday swing traders. It filters out the "noise" of smaller 1-minute or 5-minute charts while providing more timely entries than a Daily or Weekly chart.
Key Advantages for Your Trading Strategy
- Visual Trend Confirmation: By observing the alignment of the lines (the "stacking" order), you can instantly tell if the trend is bullish or bearish. A clean stack of short-term lines over long-term lines is a green light for buyers.
- Dynamic Support And Resistance: Unlike fixed horizontal levels, these lines move with the market. They often act as the "bounce point" during pullbacks in a healthy trend.
- Crossover Signal Accuracy: While a single crossover can be a false signal, the Multi Line approach requires multiple confirmations. When the entire cluster of lines shifts direction, the probability of a sustained move increases significantly.
- Volatility Measurement: The distance between the lines is a direct representation of market volatility. Wide gaps suggest volatility is expanding, while tightening lines suggest the market is "coiling" for a breakout.
How to Trade the Multi Line Moving Average
The most effective way to utilize this indicator is by watching the "Fan Out" effect. In the provided chart, as EUR/USD began its ascent on April 30th, the Multi Line Moving Average would have fanned out, signaling a shift from a bearish state to a strong bullish breakout.
Traders often use the space between the shortest and longest lines as a "value zone." If price returns to the middle of the ribbon and holds, it provides an excellent entry point with a favorable risk-to-reward ratio. Conversely, when price stays far extended from the entire cluster, the market may be "overbought," suggesting it is time to tighten stops or take profits.
By integrating the Multi Line Moving Average into your MT4 toolkit, you transform a cluttered chart into a clear, actionable roadmap for the EUR/USD and beyond.
1 Download
Last Update:
May 01, 2026 15:28 PM
Published:
Jan 29, 2026 18:22 PM
Category: