Master Intraday Volatility with the MPC Indicator for MT4
In the fast-paced world of Forex trading, staying on the right side of the trend requires more than just basic technical analysis; it requires a structured understanding of market boundaries. Many traders fail by chasing Price Action that is already overextended, leading to poor entries and unnecessary stop-outs. The MPC Indicator is a sophisticated technical tool designed to provide a clear, visual framework for market volatility, allowing traders to identify high-probability reversal and extension zones with institutional precision.
What is the MPC Indicator?
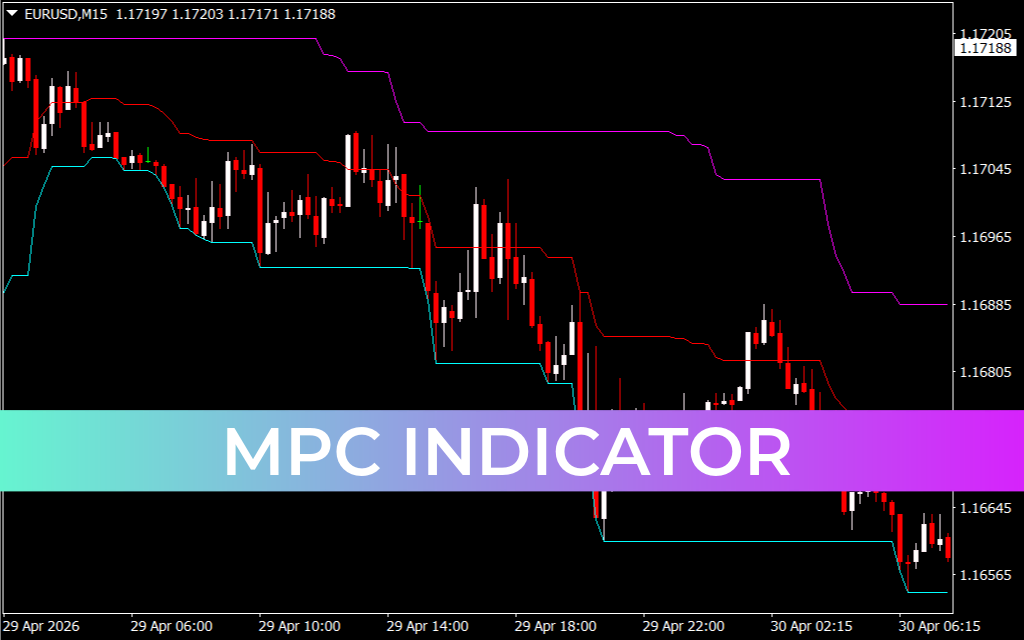
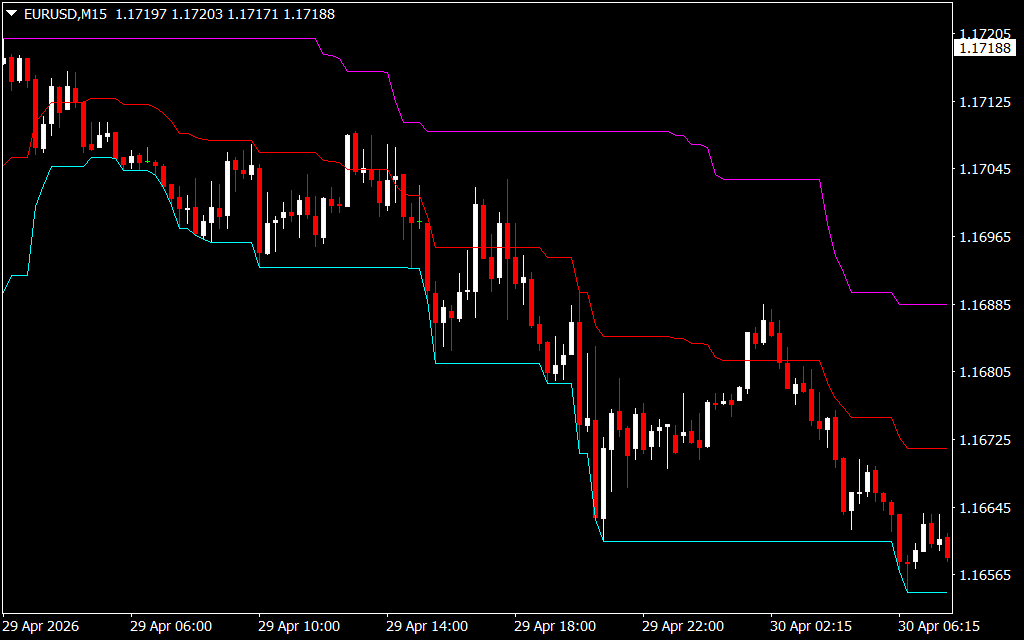
The MPC Indicator is a dynamic price channel tool—as illustrated in the provided EUR/USD M15 charts—that plots structural boundaries directly onto your trading terminal. Unlike static Support And Resistance lines, the MPC (Maximum Price Channel) utilizes a "staircase" calculation that adapts to shifting market volatility. It identifies the highest highs and lowest lows over a specific look-back period, creating a visual "envelope" that contains the majority of price action.
As shown in the recent bearish move on the EUR/USD, the indicator tracks the descent using a multi-layered channel system. The cyan (lower), red (median), and magenta (upper) lines act as a roadmap, highlighting where the price is likely to find support or face resistance during its journey.
Key Features and Strategic Advantages
- Volatility Mapping: The MPC Indicator automatically adjusts its width based on market speed. During high-impact news, the channel expands, preventing you from selling too early in a strong move. During consolidation, the channel narrows, signaling an impending breakout.
- Overextended Zone Detection: When the price touches or pierces the outer magenta or cyan lines, it is considered "overextended." As seen in the charts, these touches often precede a mean-reversion move back toward the red median line.
- Trend Confirmation: The "staircase" nature of the indicator provides immediate visual confirmation of Market Structure. A series of descending steps confirms a bearish trend, while ascending steps signal a bullish environment.
- Universal Application: While optimized for intraday timeframes like the M15, the MPC logic is equally effective for swing traders on the H4 or Daily charts, providing a consistent framework across all asset classes.
Strategy: How to Trade with the MPC Indicator
The most effective way to utilize the MPC Indicator is to treat the outer bands as high-probability "Rejection Zones." In the provided EUR/USD example, as the price aggressively tested the lower cyan boundary, the indicator leveled off, signaling that the downward momentum was stalling. A savvy trader would look for bullish price action confirmation—such as a pin bar or engulfing candle—at this boundary to target a move back to the median red line.
Furthermore, the MPC Indicator is an excellent tool for stop-loss management. By placing your stop-loss just outside the outer channel boundaries, you give your trade enough "room to breathe" while ensuring you exit if the market structure officially breaks.
Conclusion
The MPC Indicator transforms a chaotic price chart into an organized trading workstation. By defining the mathematical limits of a move, it helps traders avoid the emotional trap of "FOMO" (Fear Of Missing Out) and encourages a disciplined, data-driven approach to the markets. Whether you are a scalper or a trend-follower, the MPC Indicator provides the structural context needed to trade with confidence and clarity.
1 Download
Last Update:
May 03, 2026 01:14 AM
Published:
Jan 28, 2026 22:25 PM
Category: