Master Market Equilibrium with the Math Fmod Q1 Indicator for MT4
In the complex ecosystem of Forex trading, Price Action often feels chaotic. However, professional traders understand that markets move in mathematical cycles and levels of equilibrium. The Math Fmod Q1 Indicator for MetaTrader 4 (MT4) is a high-performance technical tool designed to reveal these hidden structures by plotting advanced mathematical Support And Resistance levels directly onto your trading terminal.
The Science of Mathematical Price Levels
The Math Fmod Q1 is not a lagging oscillator; it is a structural analysis tool. Based on quantitative models often associated with Murrey Math and harmonic cycles, the indicator divides price action into distinct horizontal zones. These levels act as "gravity centers" for price, providing traders with a roadmap of where the market is likely to stall, reverse, or accelerate.
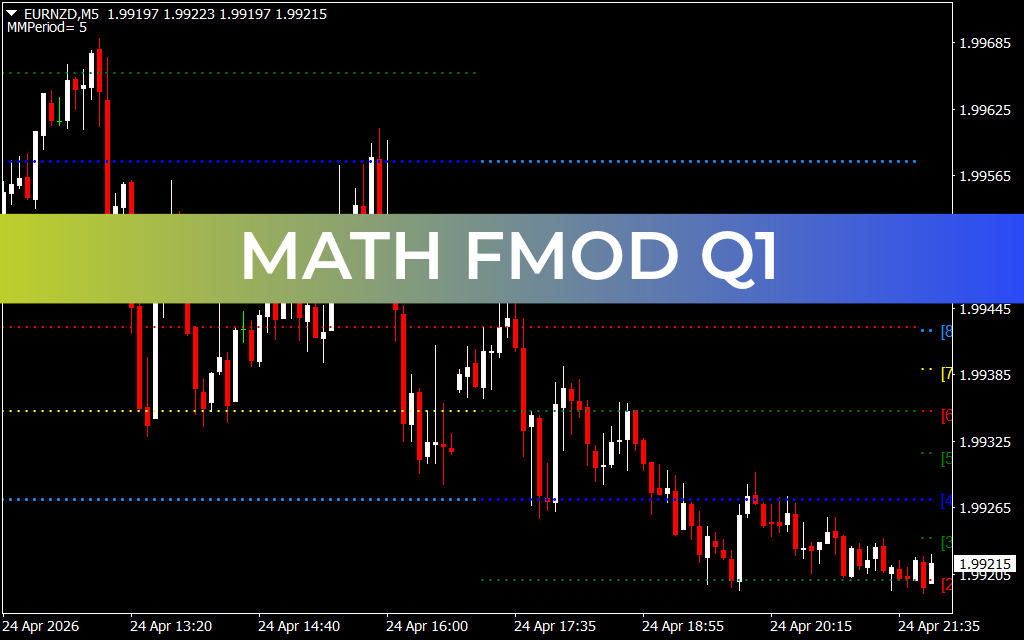
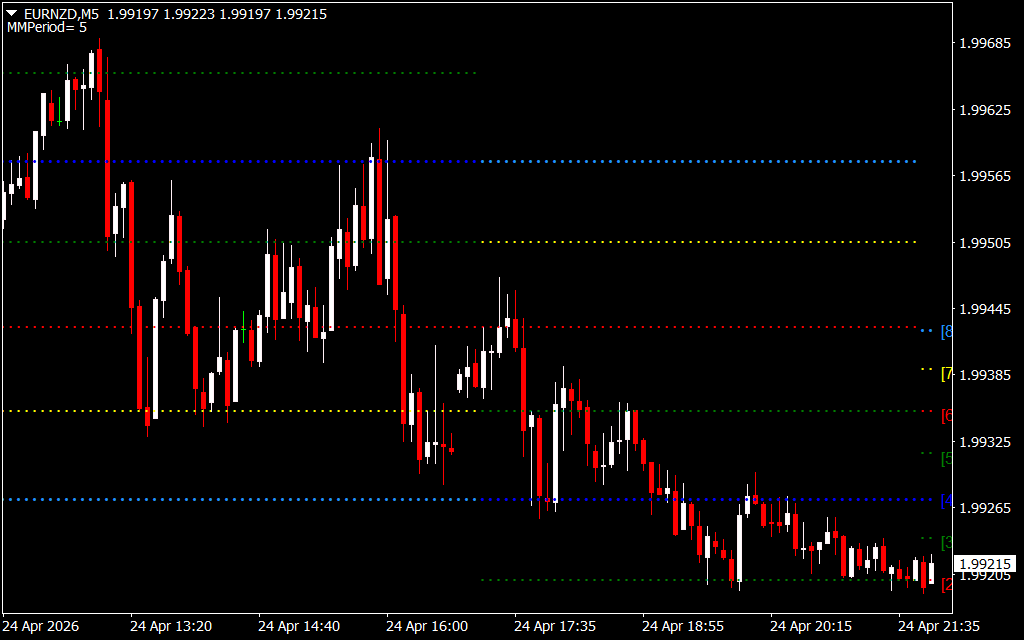
As demonstrated in the recent EURNZD M5 price action from April 24, 2026, the indicator plots a series of colorful, dashed horizontal lines across the chart:
- The Blue and Green Upper Levels: Represent major resistance zones. When price approaches these upper boundaries (near 1.99685 in the example), the mathematical probability of a retracement increases significantly.
- The Red and Yellow Median Levels: Act as the "pivot" of current market value. Price often oscillates around these central levels during periods of consolidation.
- The Light Blue and Red Lower Levels: Mark significant demand zones. As seen in the EURNZD trend, the price found consistent intraday support near the 1.99215 level, identified by the indicator’s lower bounds.
Strategic Execution and Trend Filtering
The primary advantage of the Math Fmod Q1 is its ability to identify Overextended Markets. While a standard trend-following system might suggest "selling" during a sharp drop, the Math Fmod Q1 can show that price has reached a major mathematical extreme (Level [0] or [1]), indicating that a bounce is imminent.
- Reversal Trading: Look for candlestick rejection patterns (like pin bars or engulfing candles) when price touches the outermost levels plotted by the indicator.
- Target Setting: Use the next mathematical level as your take-profit target. Because these levels are calculated based on market geometry, they are often hit with high precision.
- Volatility Assessment: The distance between the levels tells you about current market volatility. Expanding levels suggest high volatility, while contracting levels warn of an impending breakout.
Why Every Professional MT4 Trader Needs Math Fmod Q1
This indicator is engineered for clarity. It removes the guesswork from drawing manual support and resistance lines, which are often subjective and prone to human error.
- Non-Repainting Accuracy: The levels are fixed based on mathematical formulas, ensuring consistent historical analysis.
- Multi-Asset Versatility: Whether you are trading Forex pairs like EURNZD, commodities, or indices, the underlying market mathematics remain constant.
- Lightweight Performance: Optimized for MT4, it runs smoothly even when multiple charts are open.
Stop guessing where the market will turn. By integrating the Math Fmod Q1 Indicator into your trading strategy, you align yourself with the mathematical reality of price movement.
2 Downloads
Last Update:
Apr 25, 2026 14:25 PM
Published:
Feb 02, 2026 21:35 PM
Category: