Master the Markets with the Market Flow Analysis Method for MT4
In the complex ecosystem of financial trading, the ability to interpret the underlying current of Price Action is what separates professional strategists from discretionary speculators. Most indicators focus on price in isolation, but the Market Flow Analysis Method provides a holistic framework for understanding how liquidity, momentum, and institutional orders interact to create sustained trends. This method is the definitive technical solution for traders who seek to align themselves with the dominant market force across any timeframe.
What is the Market Flow Analysis Method?
Market Flow is the study of consecutive price breaks and structural shifts that indicate the direction of institutional capital. Unlike a simple moving average, the Market Flow Analysis Method identifies "Flow Highs" and "Flow Lows"—the critical structural points where the market has made a definitive statement of intent. When these levels are breached with conviction, the "Flow" is considered active in that direction.
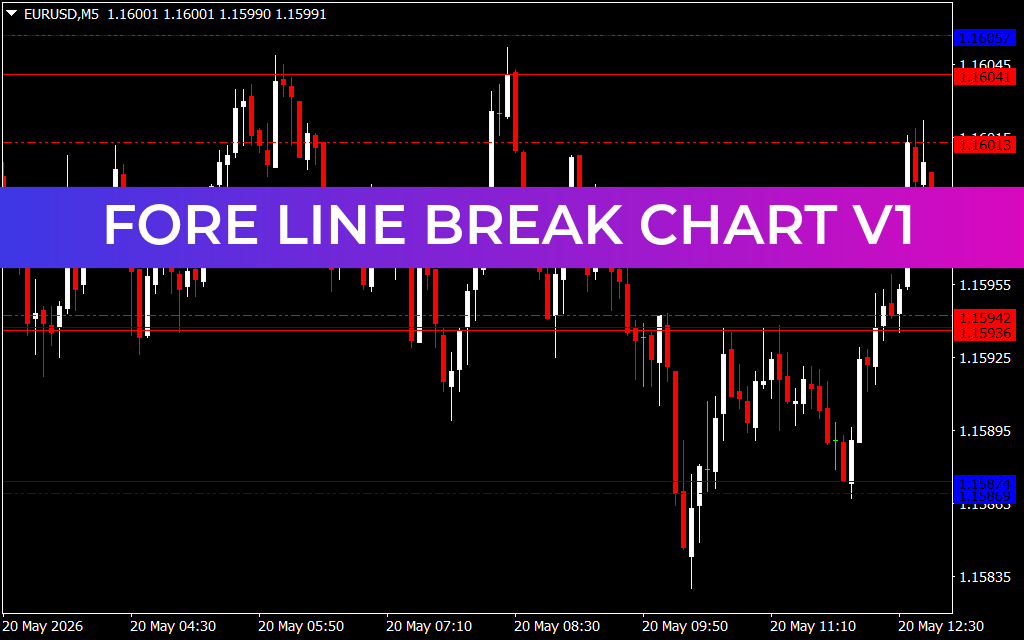
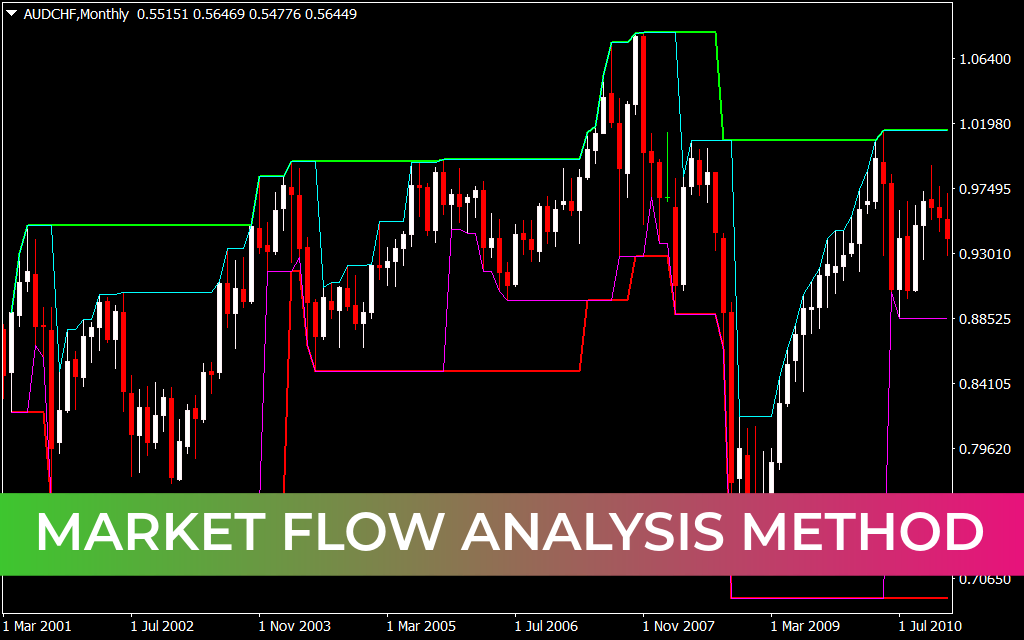
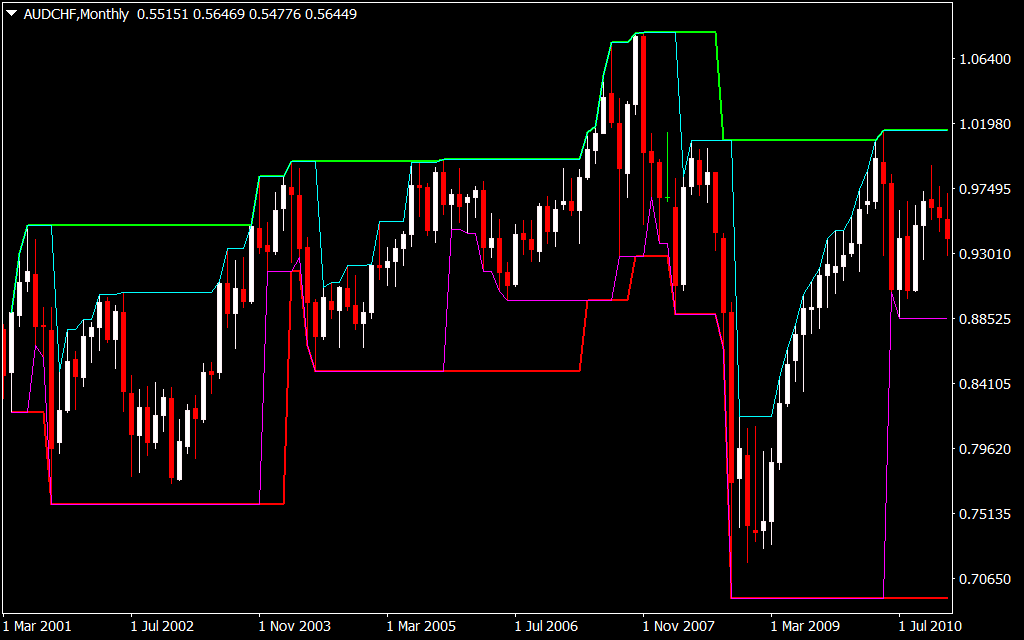
As demonstrated in the provided AUD/CHF Monthly chart, the method utilizes a multi-layered structural overlay.
- Expansion Phases: Represented by sharp vertical moves, these indicate periods where Market Flow is aggressive and directed.
- Consolidation Brackets: The horizontal levels (shown in cyan and magenta) act as the "walls" of the market. A break above the upper bracket confirms a bullish Flow, while a drop below the lower bracket signals a bearish shift.
- Institutional Zones: The indicator maps out the multi-year range, showing exactly where the "Smart Money" has historically stepped in to defend or reverse a trend.
Why Market Flow is Superior to Traditional Indicators
Traditional oscillators like the RSI or Stochastic can remain "overbought" or "oversold" for weeks during a strong trend, leading to countless false reversal signals. The Market Flow Analysis Method solves this by:
- Eliminating Subjectivity: By using mathematical structural breaks, it provides an objective "Yes/No" answer to the question: "Which way is the market moving?"
- Contextual Awareness: It forces the trader to look at the "Big Picture." On a Monthly timeframe, Market Flow reveals the macro-economic cycles that drive currency valuations over decades.
- High-Probability Filtering: It prevents you from "picking tops" in a bullish flow or "buying dips" in a bearish flow, ensuring you are always trading with the path of least resistance.
Strategic Application: The Structural Breakout
The most effective way to utilize the Market Flow Analysis Method is through Structural Confluence.
- The Setup: Identify the current Flow on a higher timeframe (e.g., Monthly or Weekly). On the AUD/CHF chart, notice how price respects the established structural brackets over long periods.
- The Entry: Wait for a "Fractal Break" on a lower timeframe (like H1 or M15) that aligns with the Monthly Flow. If the Monthly Flow is bullish, you only look for long entries when the intraday flow turns bullish.
- The Exit: Positions are held until the Market Flow physically breaks in the opposite direction, allowing you to capture the maximum "meat" of a multi-year or multi-day move.
Conclusion
The Market Flow Analysis Method is more than just an indicator; it is a complete trading philosophy. By focusing on the structural integrity of price action rather than lagging derivatives, it provides the clarity needed to navigate even the most volatile market conditions. Whether you are managing a long-term portfolio or Scalping intraday moves, mastering Market Flow is your key to institutional-grade consistency.
4 Downloads
Last Update:
Apr 28, 2026 01:03 AM
Published:
Feb 01, 2026 04:15 AM
Category: