Understanding Market Efficiency with the Market Facilitation Index (BW MFI)
In the high-stakes arena of Forex trading, volume alone doesn't tell the whole story. To truly understand price movement, a trader must evaluate how efficiently the market is moving in relation to that volume. The Market Facilitation Index (BW MFI), developed by legendary trader Bill Williams, is a unique technical indicator designed to do exactly that. By measuring the price change per unit of volume, the BW MFI reveals whether a trend is gaining genuine momentum or if the market is simply "churning" without direction.
The Mechanics of the BW MFI
The BW MFI is not a trend-following indicator in the traditional sense; rather, it is an efficiency gauge. It is calculated by taking the difference between a bar's high and low and dividing it by the volume. The real power of the indicator, however, lies in the relationship between the MFI value and the volume of the current bar compared to the previous one. This relationship is visually represented by a color-coded histogram.
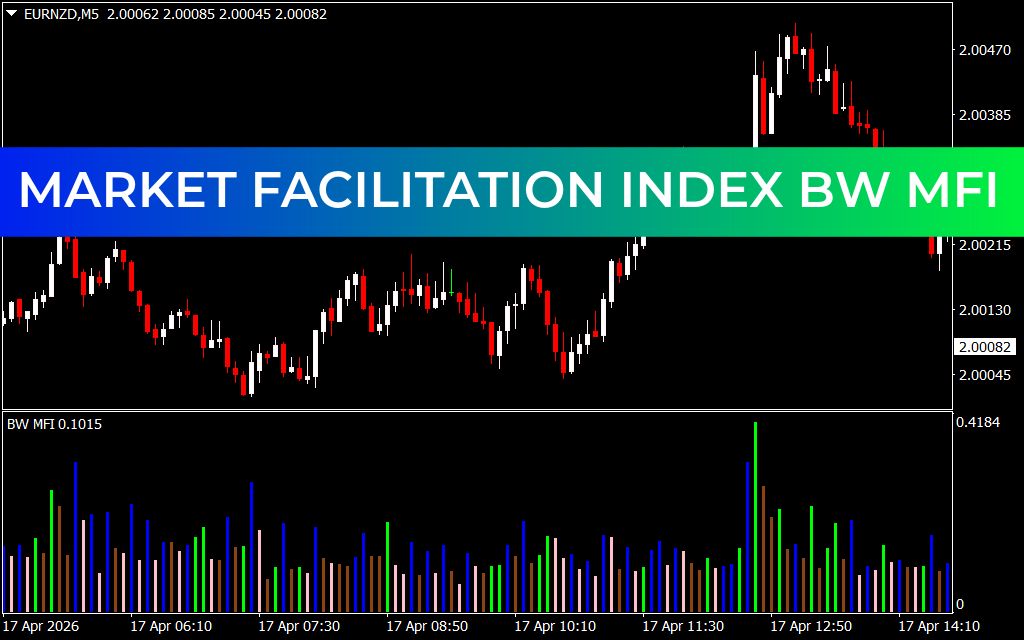
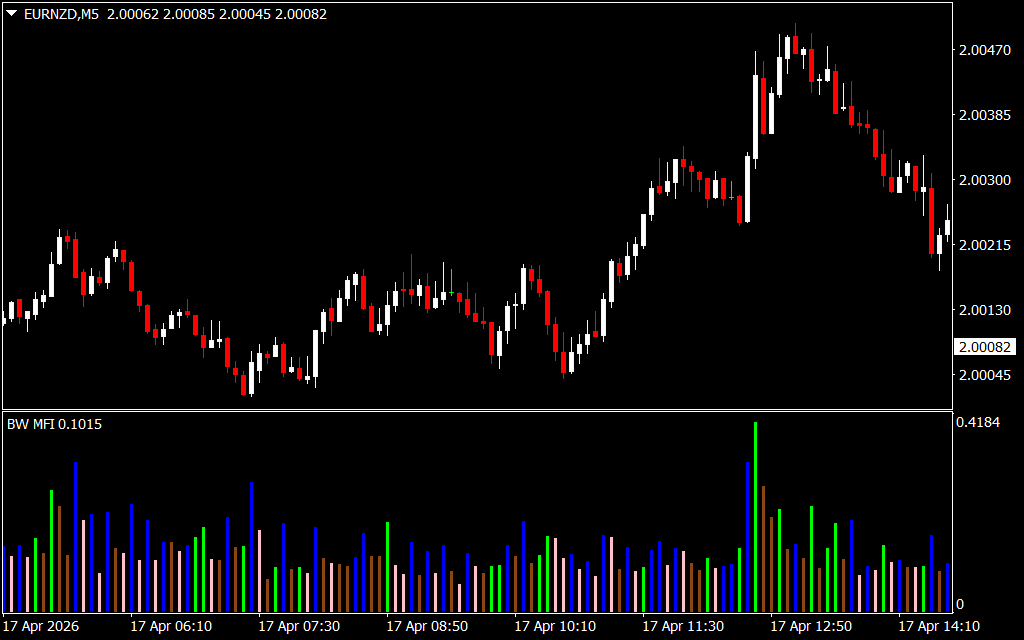
As seen on the EURNZD M5 chart, the histogram bars manifest in four distinct colors, each representing a specific market state:
- Green (The "Green" Bar): Both MFI and volume are increasing. This is a strong signal that more participants are entering the market and price movement is accelerating. It is the ultimate "go" signal for trend followers.
- Brown (The "Fade" Bar): Both MFI and volume are decreasing. The market is losing interest, and the current move is likely exhausted. This often appears at the end of a cycle.
- Blue (The "Fake" Bar): MFI is increasing, but volume is decreasing. The price is moving, but it isn't backed by high-volume institutional interest. These moves are often "fakes" driven by retail speculation.
- Pink (The "Squat" Bar): MFI is decreasing, but volume is increasing. This is perhaps the most important bar. It signifies a battle between buyers and sellers where volume is high, but price isn't moving. A breakout usually follows a "Squat."
Strategic Application on Intraday Charts
For traders operating on lower timeframes like the 5-minute (M5) or 15-minute (M15), the BW MFI acts as a critical filter. In the provided EURNZD example, the "Squat" (Pink) and "Green" bars often precede the most explosive legs of a trend. By identifying a Squat bar, a trader can prepare for an imminent breakout, while the appearance of a Fade (Brown) bar serves as an objective signal to tighten stop-losses or exit the trade.
Why Integrate the BW MFI?
The primary advantage of the BW MFI is its ability to reveal the quality of a move. It prevents traders from entering "Fake" moves and keeps them aligned with institutional flow during "Green" periods. By stripping away the complexity of lagging oscillators and focusing on the raw efficiency of Price Action, the BW MFI provides a clear, color-coded roadmap for modern market dynamics. It is an essential tool for anyone looking to master the psychological and technical nuances of the MetaTrader platform.
SEO Meta Description
1 Download
Last Update:
Apr 20, 2026 21:31 PM
Published:
Feb 03, 2026 16:54 PM
Category: