Visualizing Momentum: A Guide to the MACD Color New Trader Indicator
In the world of technical analysis, few tools are as universally respected as the Moving Average Convergence Divergence (MACD). It is a staple for everyone from retail scalpers to institutional desk traders. However, the standard MACD can sometimes be difficult for beginners to interpret quickly, especially during high-volatility sessions. The MACD Color New Trader indicator is a modern evolution of this classic tool, specifically designed to provide visual clarity and faster decision-making for traders at all levels.
What is the MACD Color New Trader?
The MACD Color New Trader is a trend-following Momentum Indicator that sits in a sub-window below your primary price chart. While it retains the core mathematical logic of the traditional MACD—measuring the relationship between two exponential moving averages—it enhances the output with a color-coded histogram.
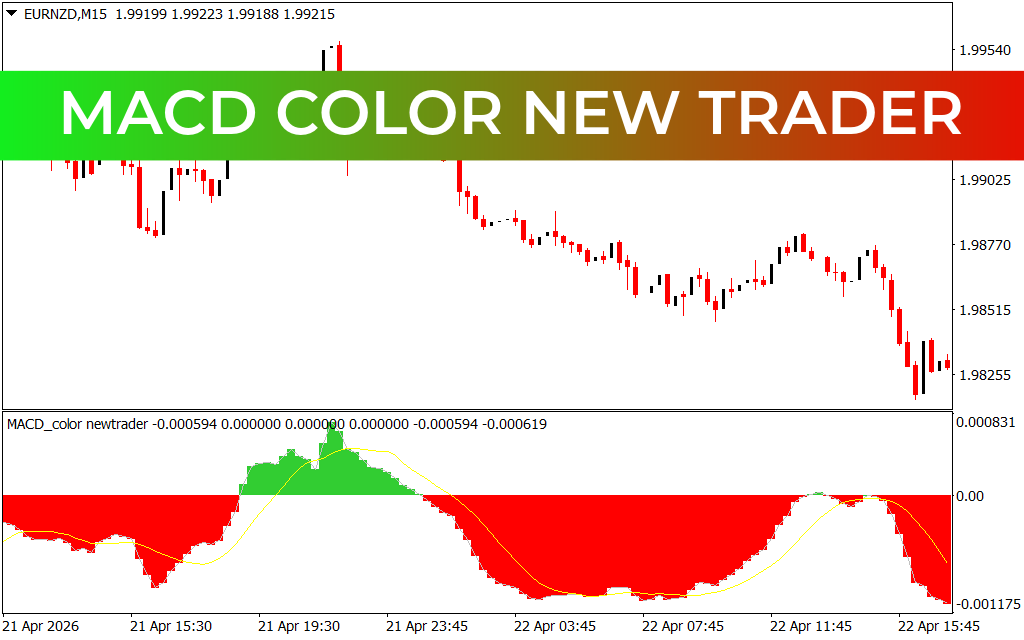
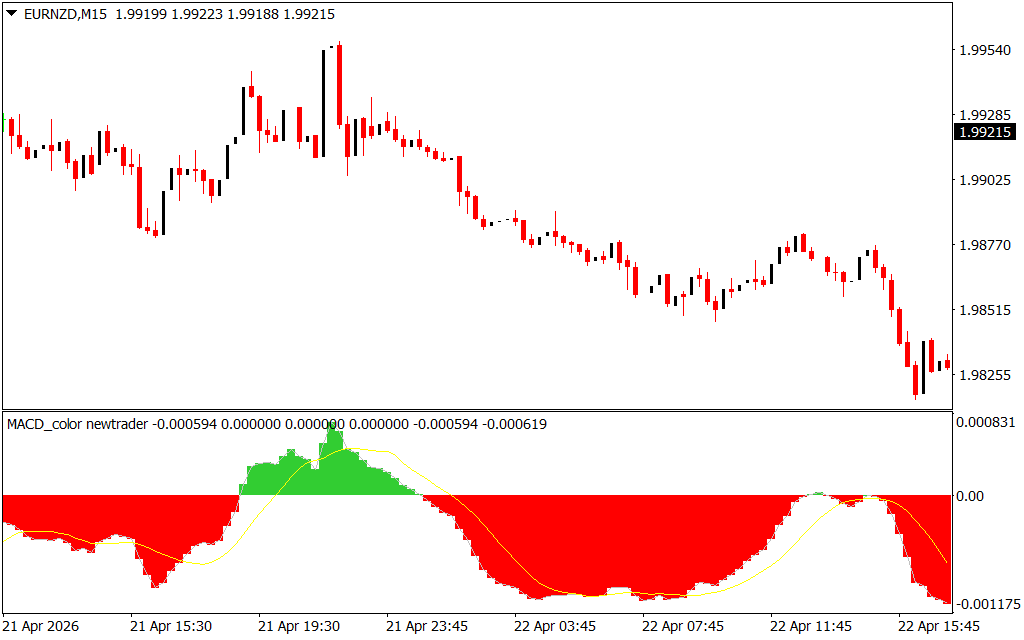
As seen in the EURNZD M15 analysis, this indicator replaces the standard gray bars with vibrant red and green zones. This allows a trader to identify market sentiment instantly without having to squint at tiny lines or calculate crossovers manually.
Decoding the Color Signals
The primary strength of this indicator is its intuitive design. It breaks down complex momentum data into three digestible signals:
- Green Histogram (Bullish Momentum): When the histogram bars are green and rising above the zero-line, it signifies that buyers are in control. The taller the green bars, the stronger the upward "surge."
- Red Histogram (Bearish Momentum): When the bars turn red and drop below the zero-line, selling pressure is dominant. In the provided EURNZD chart, the large red "valley" perfectly maps the sustained bearish trend where price dropped from 1.99285 toward 1.98255.
- The Signal Line (Yellow): The smooth yellow line acts as a moving average of the histogram itself. When the histogram crosses the signal line, it often provides an early warning of a trend shift before the Price Action fully reflects the change.
Strategic Advantage for New Traders
The "New Trader" designation in this indicator's name highlights its focus on usability.
- Filtering False Breakouts: By waiting for the histogram to transition from red to green (or vice-versa), traders can avoid entering trades during "choppy" consolidation periods where price is moving sideways.
- Divergence Spotting: One of the most powerful ways to use the MACD Color New Trader is to look for divergence. If the price makes a new low but the red histogram shows a shallower valley than the previous one, a bullish reversal is likely imminent.
- Timeframe Versatility: While highly effective on the M15 for intraday moves, this indicator remains robust on H1 and D1 timeframes, making it a versatile companion for any trading style.
Conclusion
The MACD Color New Trader takes a legendary formula and gives it a professional, user-friendly makeover. By prioritizing visual intuition through its color-coded system, it helps traders stay disciplined and aligned with the true momentum of the market. If you want to strip away the confusion of traditional oscillators and see the trend for what it really is, this indicator is a vital addition to your MetaTrader toolkit.
2 Downloads
Last Update:
Apr 25, 2026 16:43 PM
Published:
Feb 02, 2026 17:54 PM
Category: