Unlocking Institutional Confluence: Trading Trends with the MACD And Volumes Indicator
In modern financial markets, sustained profitability relies on a single rule: never trade Price Action in a vacuum. On fast-paced intraday timeframes like the 30-minute (M30) chart, currency pairs like the EUR/USD constantly subject retail day traders to false breakout signals and deceptive exhaustion spikes. Many traders rely entirely on standard momentum oscillators to time entries, only to watch their positions get run over because the underlying market lacked the transactional liquidity to sustain the move. To filter out bad setups with clinical precision, professional technical analysts combine momentum with volume confirmation.
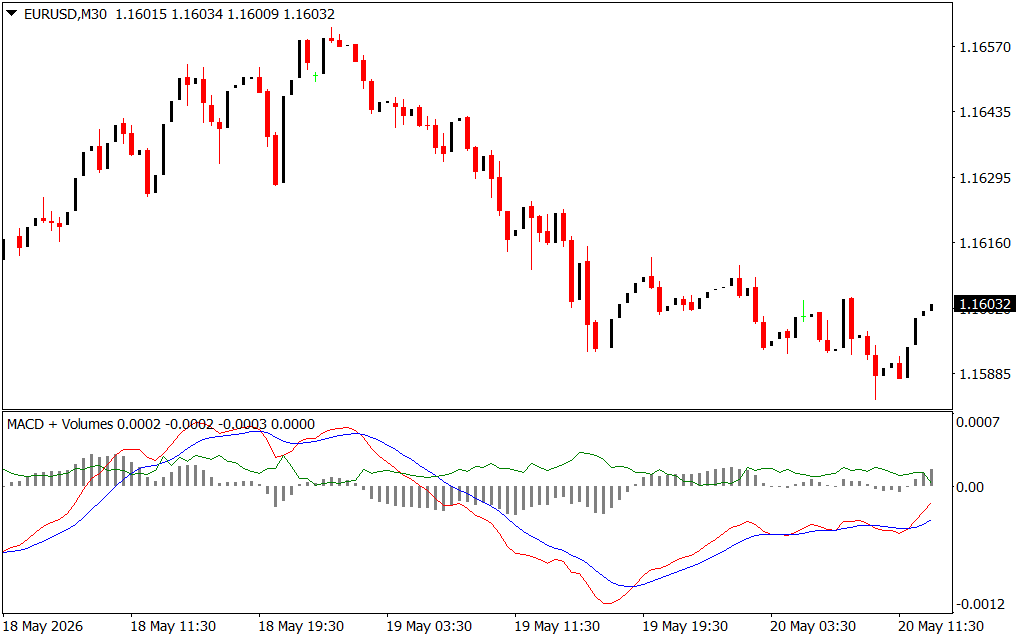
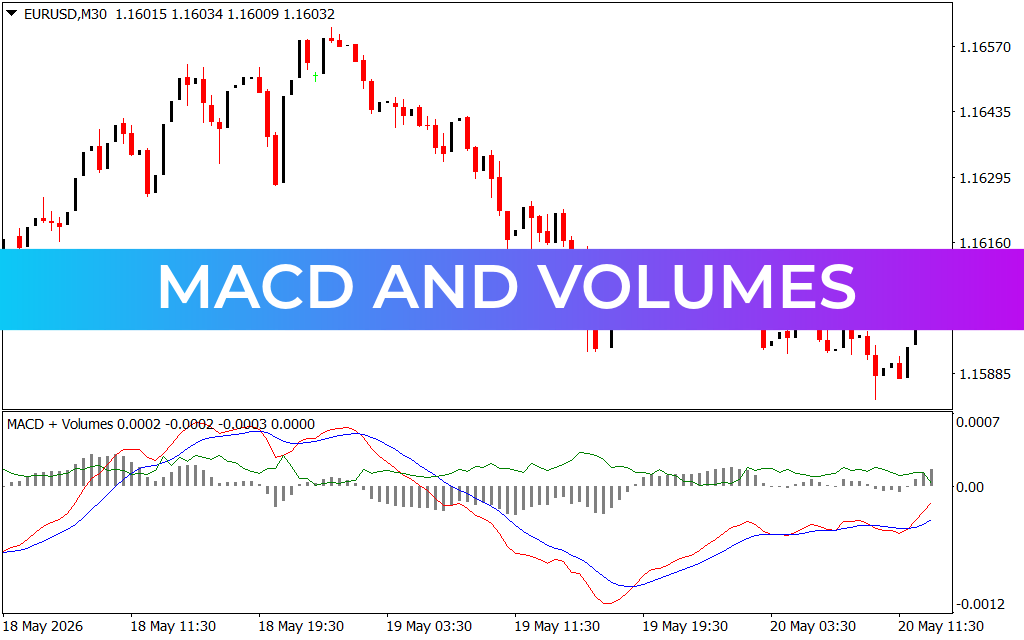
Looking closely at the EUR/USD M30 price delivery across the recent session, the asset maps out a complete structural cycle. Following an extended distribution phase at major technical ceilings, a massive institutional markdown sequence drives price steadily lower, printing lower highs and lower lows down to a structural floor near 1.15885. Immediately following this exhaustive selling climax, heavy accumulation stabilizes the market, triggering an aggressive, multi-candle recovery back above the 1.16032 level. Capturing these massive trend reversals requires an aggregated view of both momentum and institutional volume—precisely what the MACD And Volumes indicator delivers.
The Power of Dual-Engine Technical Confirmation
The standard Moving Average Convergence Divergence (MACD) is a brilliant momentum tool, but it lacks any insight into whether market participants are backing a directional push. This upgraded system integrates a highly optimized volume smoothing matrix directly inside the classic technical oscillator window, displaying a comprehensive, multi-line sub-panel:
- Sustained Momentum Tracking (The Blue and Red Signal Lines): The primary blue momentum line and red signal curve track the acceleration of institutional price delivery. During the primary markdown phase, the curves remain cleanly crossed downward below the zero-bound line, instructing day traders to exclusively favor short configurations and ignore weak retail counter-moves.
- Volume Distribution Histogram (The Grey Volatility Blocks): Positioned at the center of the window, the custom histogram measures the absolute volume supporting each market swing. Notice the exact moment the EUR/USD bottoms out near 1.15885. As price flattens, the downward histogram bars rapidly shrink back toward the zero-line. This reduction signals that selling pressure has dried up and institutional buyers have actively stepped in to absorb remaining orders.
- Confluence Entry Signals: The absolute optimal entry trigger occurs when a crossover of the momentum lines aligns perfectly with a volume expansion block. As the market coordinates its V-shaped recovery, the steady expansion of the upper volume bars confirms that fresh institutional liquidity is backing the upward push, protecting traders from entering a weak, low-volume trap.
Upgrading Your Technical Platform Infrastructure
To build a resilient trading edge, you must replace emotional chart interpretation with a standardized, mechanical workflow. Automating your trend and volume validation removes psychological hesitation from your routine. The MACD And Volumes indicator features a highly optimized backend codebase, ensuring smooth data streaming across your charts without inducing terminal lag.
The fully customizable interface allows you to fine-tune lookback lengths, adapt visual color palettes to match your personal workspace design, and establish real-time push or audio alerts. Integrating this institutional tool into your MetaTrader terminal provides the structural clarity needed to align your capital with dominant market drivers and grow your equity base with absolute discipline.
1 Download
Last Update:
May 20, 2026 16:37 PM
Published:
Jan 18, 2026 15:07 PM
Category: