Visualizing Market Structure with the MA Color Applied Price Indicator
In the foundational world of technical analysis, the Moving Average (MA) is an indispensable tool. It serves as the primary filter for trend identification and price smoothing across every liquid market on the globe. However, traditional moving averages can sometimes be static and difficult to interpret during rapid price shifts. The MA Color Applied Price indicator is a sophisticated evolution of this classic concept, designed to provide immediate, color-coded feedback on trend health directly on your MetaTrader charts.
The Logic of Dynamic Trend Shifting
The MA Color Applied Price indicator goes beyond simple smoothing by integrating a real-time color-change mechanism based on the relationship between Price Action and the average. By applying the calculation to specific price points (Applied Price), the indicator becomes more reactive to market volatility than standard closing-price averages.
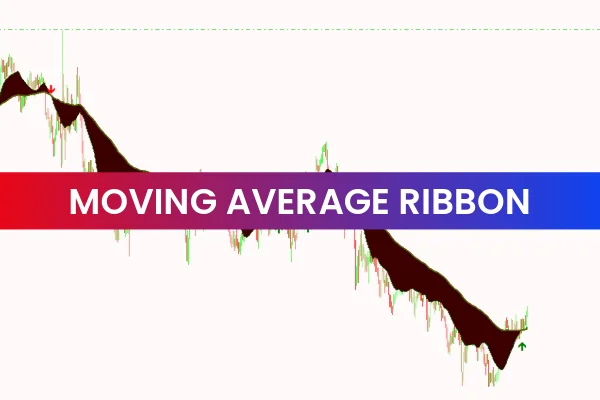
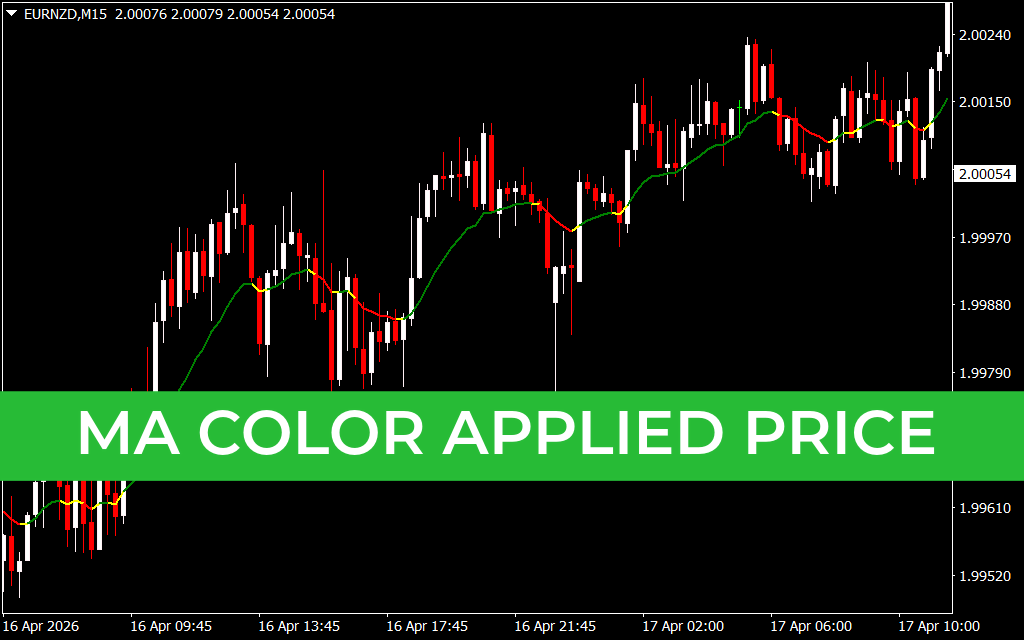
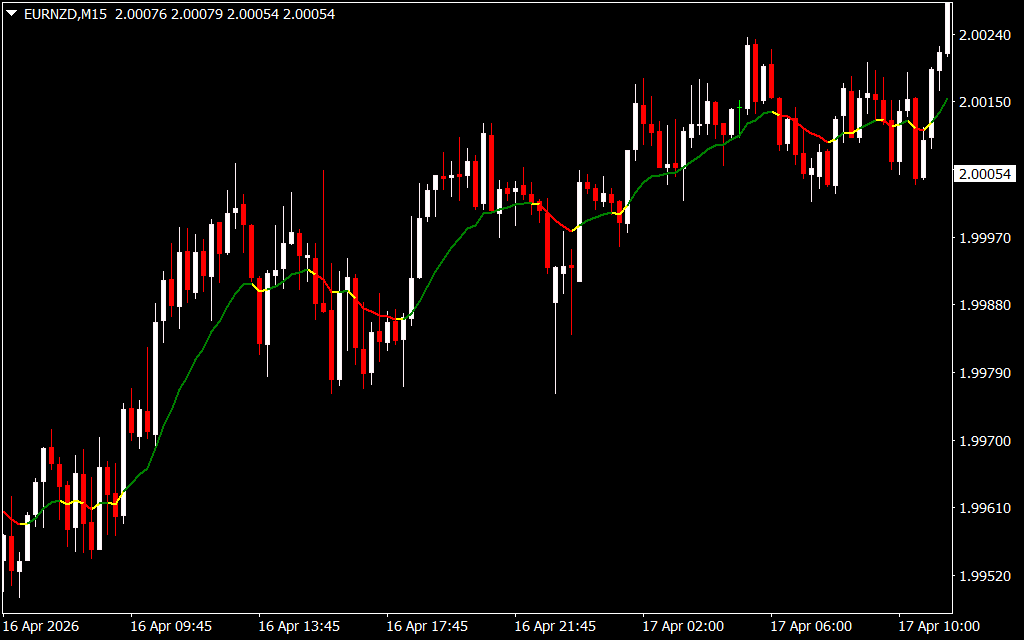
As demonstrated on the EURNZD M15 chart, the indicator provides a clear, intuitive roadmap of market bias:
- Green Ribbon: When the indicator turns green and price remains above the line, the market is in a confirmed bullish expansion. This signals that demand is consistently outstripping supply.
- Red Ribbon: When the line shifts to red and price stays below it, a bearish trend is in control. This serves as a continuous warning to avoid long positions.
- Yellow Transitional Zones: Short yellow segments appear when the trend is losing momentum or entering a potential reversal phase. This is the ultimate "caution" signal, urging traders to lock in profits or wait for a fresh breakout.
Strategic Versatility: From Scalping to Swing Trading
One of the greatest strengths of the MA Color Applied Price system is its adaptability. While it provides surgical precision for scalpers on the 5-minute (M5) chart, it is equally powerful for swing traders on the 15-minute (M15) or 1-hour (H1) timeframes.
- The "Single-Line" Strategy: Many professional traders use this indicator as their sole decision-maker. If the line is green, you only look for buy entries on minor pullbacks to the line. If it is red, you sell the rallies.
- Confluence Filter: Use the MA Color as a structural filter for other indicators. For example, only take RSI "oversold" signals if the MA Color is currently green, ensuring you are always trading with the path of least resistance.
- Dynamic Support And Resistance: The color-coded line acts as a "moving" level of support or resistance. In a strong trend, price will often bounce off the green or red ribbon, providing high-probability re-entry points.
Why It’s a Must-Have for Modern Traders
In a market driven by high-frequency algorithms, visual clarity is your edge. The MA Color Applied Price indicator removes the psychological hesitation that comes with analyzing traditional black-and-white charts. It transforms complex trend data into a simple, actionable visual that tells you exactly who is in control of the market.
By integrating this tool into your MetaTrader platform, you gain a professional-grade dashboard for trend identification. Whether you are navigating the high volatility of EURNZD or tracking major pairs, this indicator ensures you stay on the right side of the market with confidence and discipline.
8 Downloads
Last Update:
Apr 20, 2026 21:47 PM
Published:
Feb 03, 2026 15:57 PM
Category: