Precision Trading with the Kairi Indicator: Identifying Market Extremes
In the search for an edge in the financial markets, traders often overlook classic oscillators that provide deep insight into price deviations. The Kairi Indicator (also known as the Kairi Relative Index or KRI) is a powerful technical analysis tool designed to measure the distance between the current price and its moving average. By quantifying this "stretch," the Kairi Indicator helps traders identify overextended market conditions that often precede significant reversals.
Understanding the Mechanics of Kairi
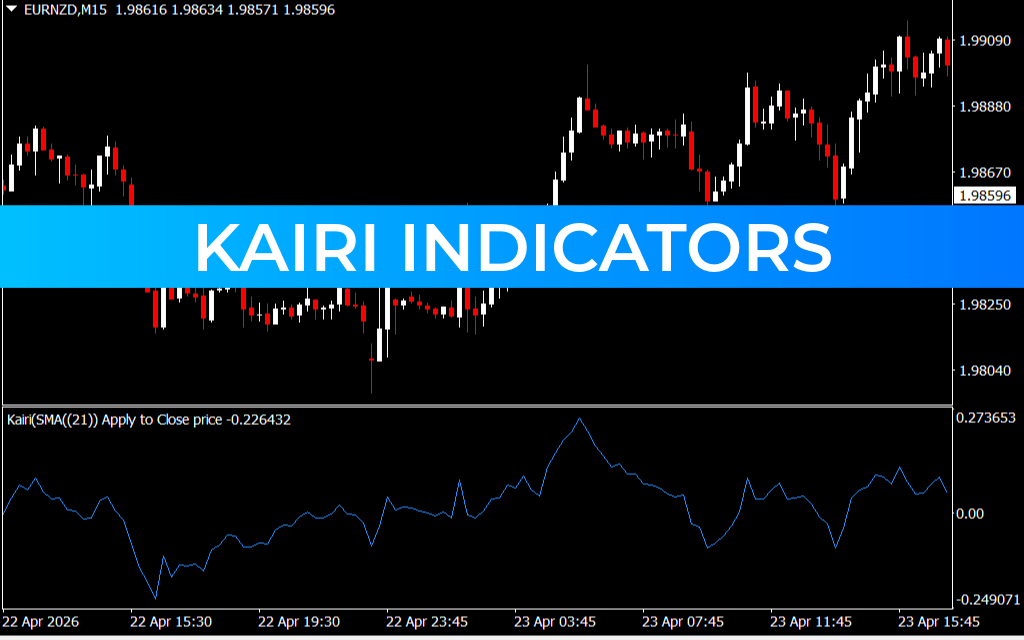
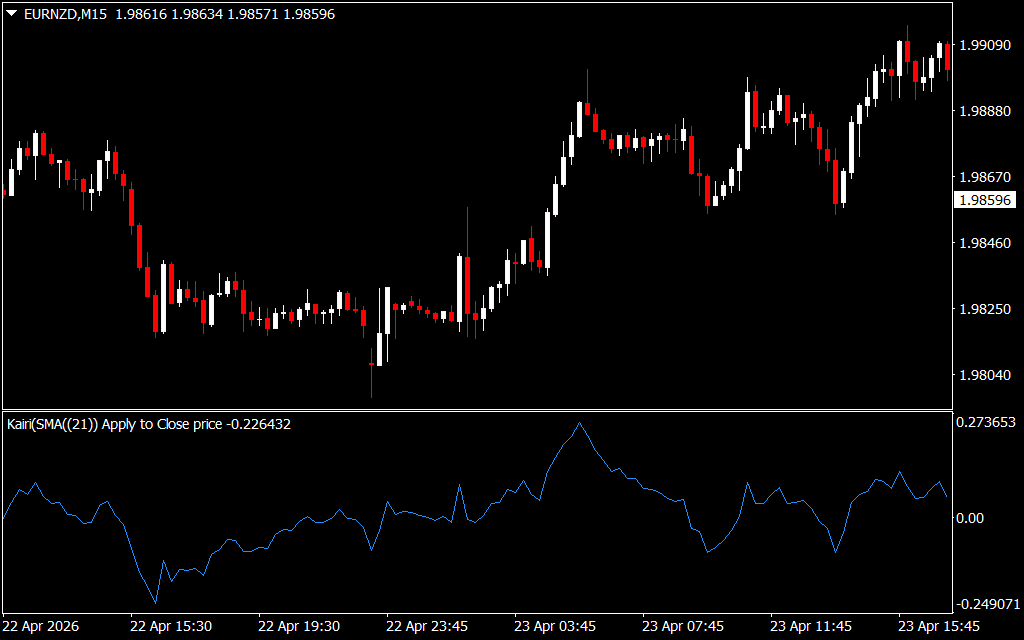
The core logic of the Kairi Indicator is based on the principle of mean reversion. It calculates the percentage divergence of the current price from a specific simple moving average (SMA), typically set to a 14 or 21-period window. When the price moves too far away from this average, the Kairi value rises or falls into extreme territory, suggesting that the market is either overbought or oversold.
On a MetaTrader 4 (MT4) or MT5 chart, the indicator appears in a separate window as a fluctuating line around a zero level. Unlike bounded oscillators like the RSI, the Kairi Indicator is unbounded, allowing it to reflect the true intensity of volatile price swings.
How to Trade with the Kairi Indicator
Successful implementation of the Kairi Indicator requires looking for specific technical setups:
- Extreme Divergence: When the indicator reaches historically high levels, it suggests a bullish exhaustion. Conversely, deep negative values suggest bearish exhaustion. These are high-probability zones for counter-trend trades.
- Zero-Line Crossings: A cross above the zero line confirms that the price has moved above its average, indicating a shift toward bullish momentum. A cross below zero suggests the bears are taking control.
- Trend Following: During a strong trend, the Kairi line will often stay above or below the zero line. Traders can use "pullbacks" toward the zero line as opportunities to join the prevailing trend at a better price.
Optimization and Strategy Integration
While the Kairi Indicator is highly effective on its own, it excels when paired with other technical filters. For example, using the Kairi on an M15 chart alongside a longer-term trend filter (like a 200-period EMA) allows scalpers to pick off high-probability entries in the direction of the primary trend.
Because it reacts quickly to price changes, the Kairi is a favorite among intraday traders who need to see exactly when a price spike has become unsustainable. By adding this tool to your trading arsenal, you can move away from chasing price and start anticipating the natural corrections that drive market cycles.
3 Downloads
Last Update:
Apr 27, 2026 15:45 PM
Published:
Feb 01, 2026 19:26 PM
Category: