Multi-Timeframe Mastery: Navigating the Markets with K Lines
In the fast-paced environment of Forex trading, many traders fall into the trap of "tunnel vision." They become so focused on a single timeframe that they lose sight of the broader Market Structure, leading to entries that run directly into high-level resistance. The K Lines indicator (part of the Kale Workshop suite) is a professional-grade technical tool designed to solve this by projecting critical price levels from multiple timeframes directly onto your current chart.
What is the K Lines Indicator?
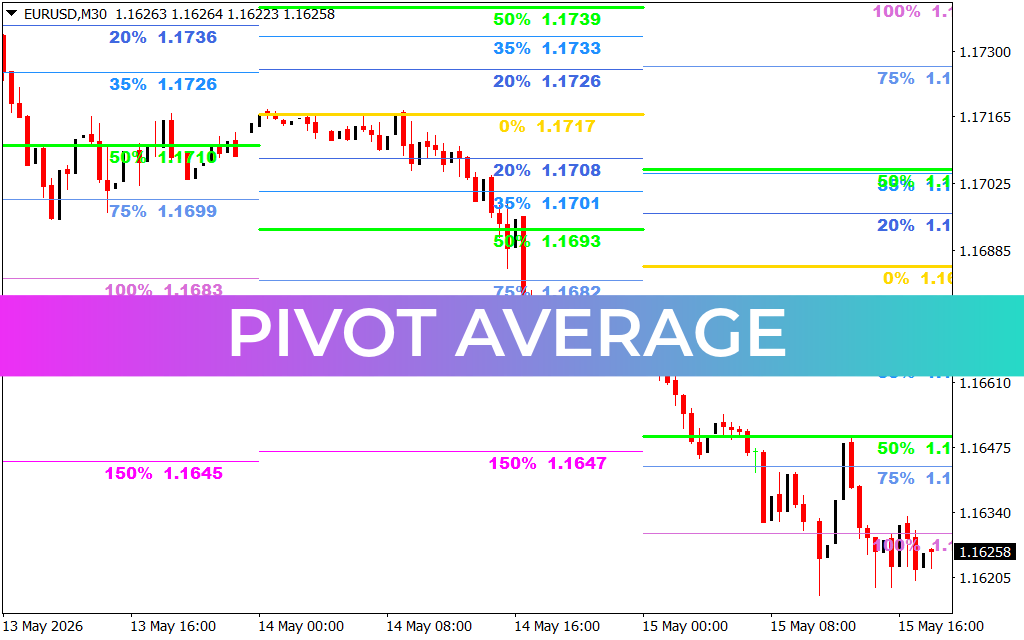
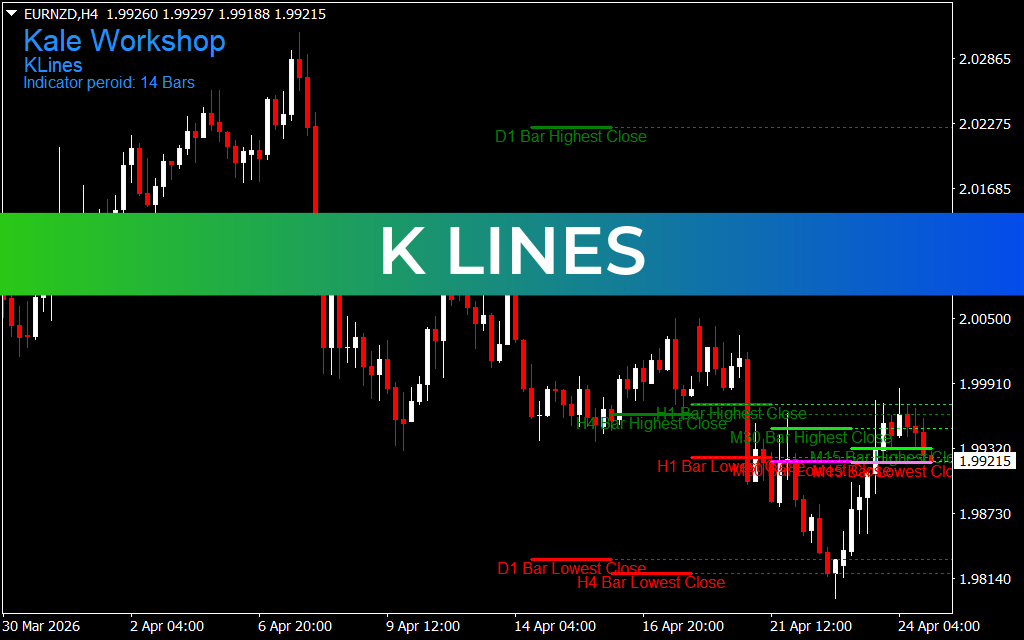
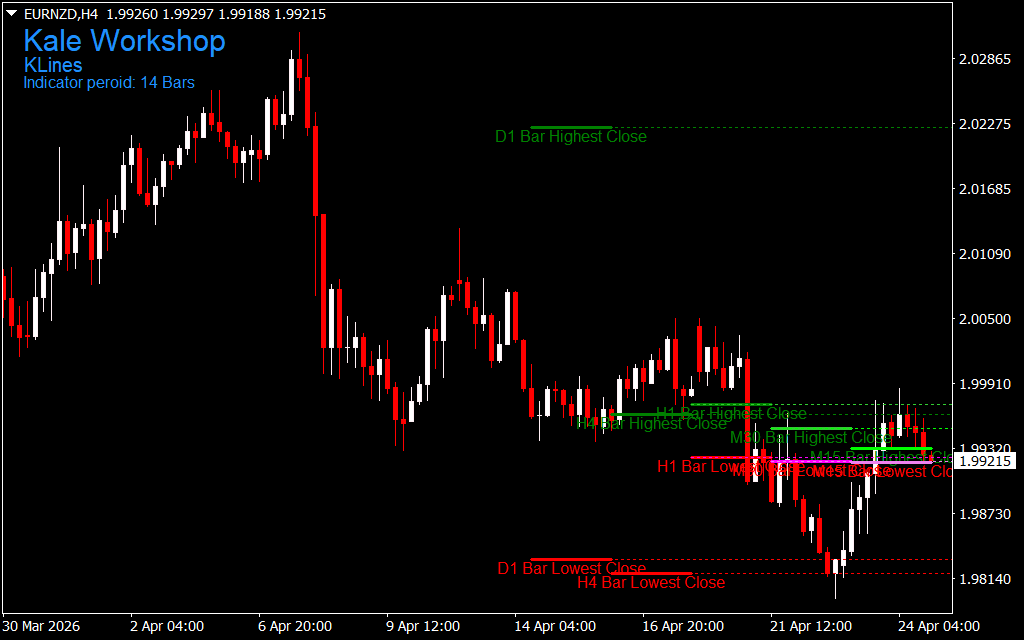
K Lines is a multi-timeframe (MTF) horizontal level indicator that identifies the highest and lowest closing prices over a specific period (typically 14 bars) across various time horizons. As seen in the EURNZD H4 chart, the indicator automatically plots color-coded support and resistance lines derived from the Daily (D1), Four-Hour (H4), One-Hour (H1), and even 15-minute (M15) charts.
Instead of manually flipping through charts to find where the "big players" are leaning, K Lines brings that data to you. It creates a "map" of significant price zones that act as natural magnets or barriers for Price Action.
Understanding the Level Hierarchy
The power of K Lines lies in its ability to show the "confluence" of different timeframes. The indicator uses a specific visual hierarchy to help traders prioritize levels:
- D1 Bar Highest/Lowest Close (Green/Red dashed): These are the major structural boundaries. In the EURNZD example, the D1 Highest Close near 2.02275 and the D1 Lowest Close near 1.98140 define the broad trading range for the month.
- H4 and H1 Levels: These lines provide the "inner" structure. When an H4 Highest Close aligns closely with an H1 Highest Close, it identifies a "Strong Resistance" zone where a reversal is highly probable.
- Intraday M30 and M15 Levels: These shorter-term lines are essential for scalpers and day traders, identifying the immediate range within which the current price is oscillating.
Strategic Application for Trend and Range Trading
K Lines transforms a standard candlestick chart into a tactical grid. Traders can utilize these levels in several ways:
- Breakout Confirmation: If price breaks above a "D1 Bar Highest Close" level, it signals a significant structural shift, often leading to a powerful Trend Continuation.
- Target Selection: When entering a trade, the K Lines provide logical, data-driven "Take Profit" targets. A trader going long might look to exit just below the next major H4 or D1 resistance line.
- Stop Loss Placement: Placing stop losses just beyond a "Lowest Close" level from a higher timeframe ensures that your trade is protected by significant market structure, reducing the chance of being "stopped out" by minor noise.
Conclusion
The K Lines indicator is an indispensable tool for traders who value structural clarity over indicator clutter. By automating the identification of multi-timeframe highs and lows, it ensures you are always aware of the "big picture," regardless of which chart you are trading. Whether you are navigating a volatile reversal on the EURNZD or looking for a stable trend on major pairs, K Lines provides the institutional-level perspective required for consistent success.
9 Downloads
Last Update:
Apr 25, 2026 17:02 PM
Published:
Feb 02, 2026 17:39 PM
Category: