Maximizing Volatility Profits with the HL Bollinger Indicator for MT4
In the world of technical analysis, few tools are as revered as Bollinger Bands. Designed to measure market volatility and identify overbought or oversold conditions, they provide a visual "envelope" for price action. However, professional traders often require a more nuanced view of Market Structure than standard bands provide. The HL Bollinger Indicator for MetaTrader 4 is an advanced evolution of this classic tool, specifically engineered to integrate High/Low price extremes into its volatility calculations for superior precision.
What is the HL Bollinger Indicator?
The standard Bollinger Band formula uses a simple moving average and standard deviation based on closing prices. The HL Bollinger variation shifts this focus by incorporating the "High" and "Low" of each candle into its bandwidth logic. This creates a more reactive and comprehensive boundary that accounts for intraday spikes and volatility tails that "close-only" indicators often miss.
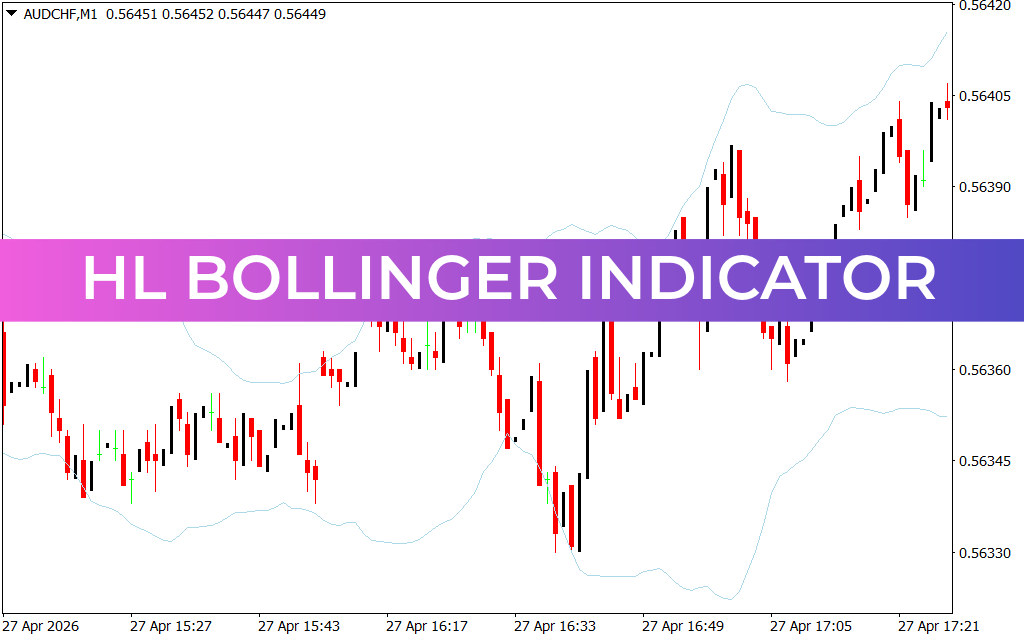
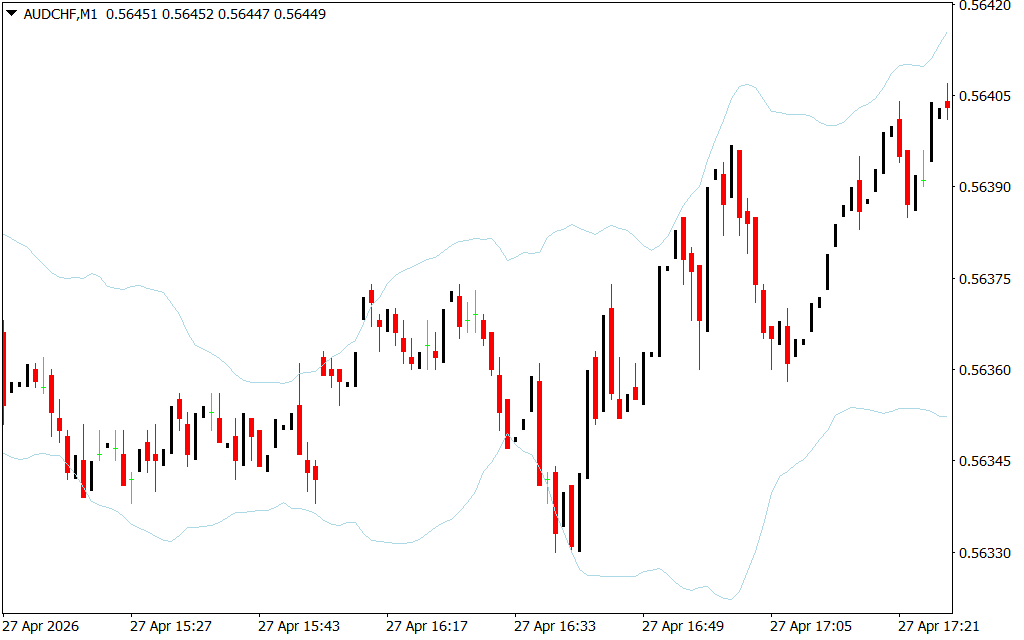
As seen in the provided AUD/CHF M1 chart, the indicator appears as two fluid, light-blue lines flanking the Price Action.
- The Upper Band: Acts as a dynamic resistance level, representing the upper threshold of statistical price movement.
- The Lower Band: Acts as dynamic support, marking the lower boundary of the current volatility range.
- Band Expansion: When the lines move apart (as seen during the mid-chart rally), it signals increasing market volatility and the start of a potential trend.
- Band Contraction: When the lines tighten (the "squeeze"), it indicates a period of low volatility, often preceding a massive breakout.
Why the HL Version is Superior
- Capturing True Extremes: By using High/Low data, the HL Bollinger Indicator ensures that stop-run spikes are factored into the volatility envelope. This reduces "false breakouts" where price momentarily pierces a standard band but remains within the HL range.
- Precision Scalping: On the M1 timeframe shown, scalpers can use the bands to identify "reversion to the mean" trades. When price touches the lower HL band and shows a bullish rejection, it provides a high-probability entry for a move back toward the center of the range.
- Improved Trend Riding: During a strong trend, price will often "walk the bands." The HL version provides a clearer "buffer" zone, helping traders stay in a winning position without being shaken out by minor fluctuations.
Strategic Application: The Volatility Squeeze
The most powerful way to use the HL Bollinger Indicator is to identify the Bollinger Squeeze. When the market enters a period of consolidation, the bands will narrow significantly. This indicates that energy is building up.
- Bullish Breakout: A candle close above the upper HL band after a squeeze signals a high-probability buy.
- Bearish Breakout: A candle close below the lower HL band signals a dominant sell move.
On the AUD/CHF chart, notice how the bands provide a clear "lane" for price. As price trends upward, the bands expand to accommodate the move, providing structural targets for taking profit or trailing stops.
Conclusion
The HL Bollinger Indicator is an essential upgrade for any MetaTrader 4 user who relies on volatility-based strategies. By anchoring its calculations to High/Low price data, it offers a more "truthful" representation of market boundaries than standard implementations. Whether you are a M1 scalper or a H1 trend follower, this indicator provides the clarity needed to trade with confidence.
1 Download
Last Update:
Apr 27, 2026 22:12 PM
Published:
Feb 01, 2026 12:29 PM
Category: