Navigating Market Volatility with the GRF Leading Edge Indicator
In the pursuit of trading excellence, understanding the boundaries of Price Action is paramount. While standard moving averages provide a baseline, they often fail to capture the dynamic elasticity of the market. The GRF Leading Edge indicator is a sophisticated technical tool designed to solve this problem by creating a comprehensive "price envelope" that maps out high-probability reversal and continuation zones.
What is the GRF Leading Edge?
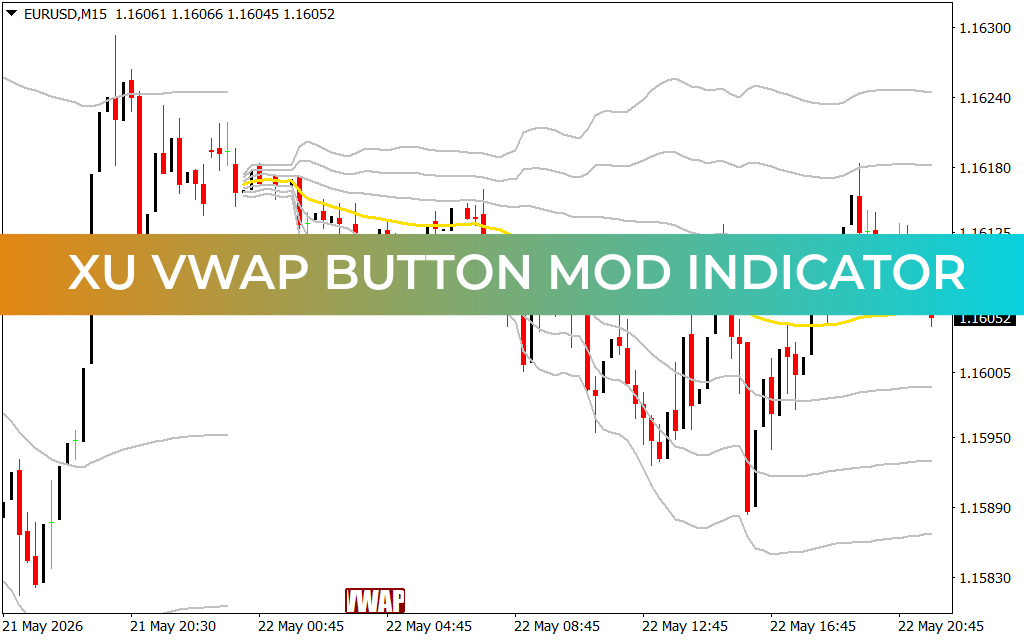
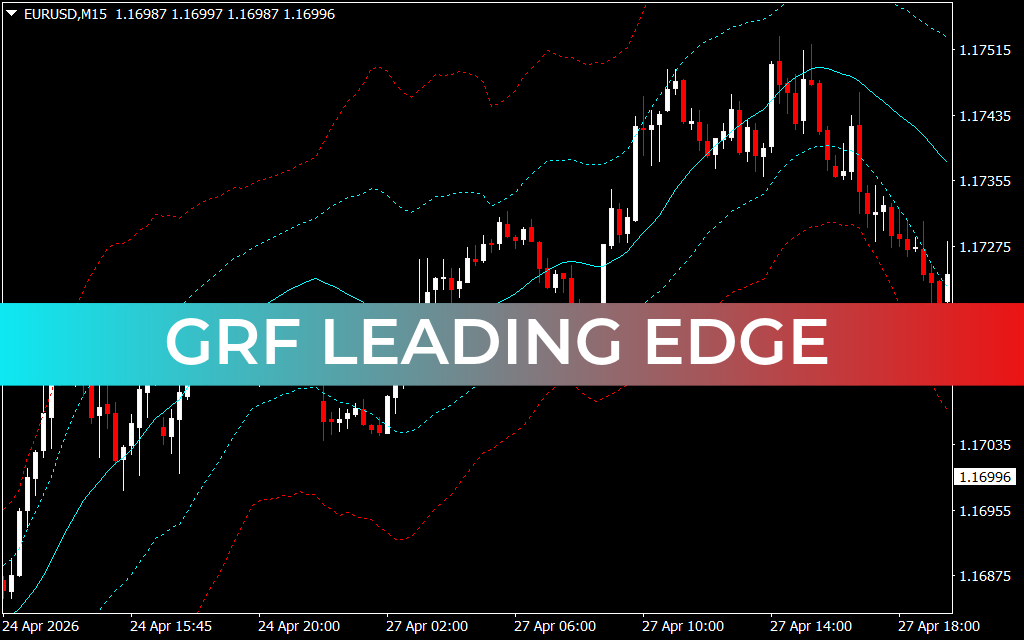
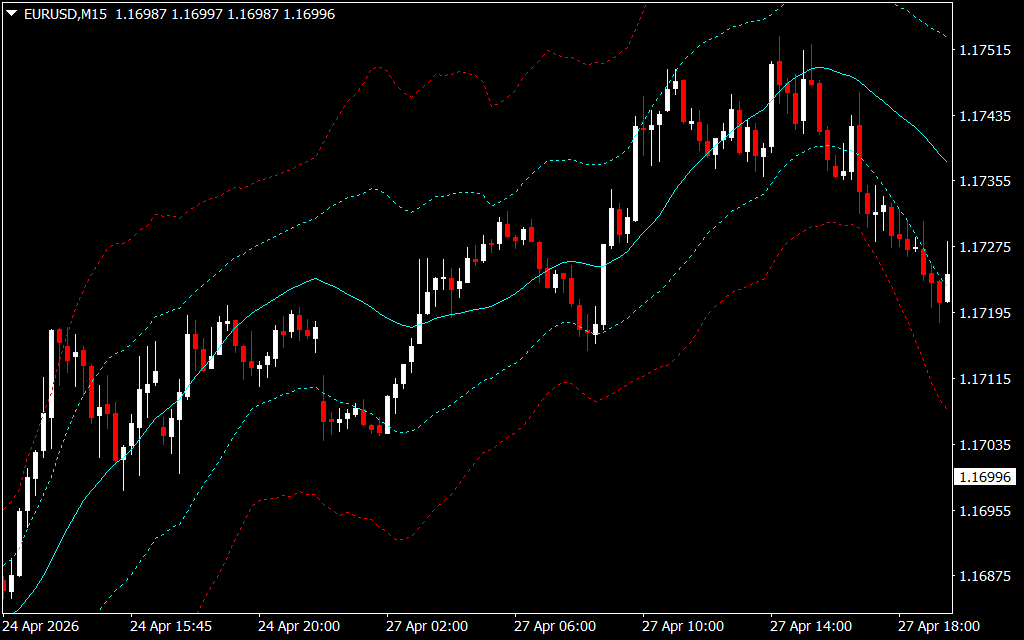
The GRF Leading Edge is a volatility-based channel indicator that functions similarly to Bollinger Bands or Keltner Channels but with a proprietary mathematical twist. It plots multiple sets of bands—often referred to as "inner" and "outer" edges—around a central mean. These bands expand and contract in real-time based on market momentum and price dispersion.
By visualizing the "Leading Edge" of a price move, traders can see not just where the price is, but where it is likely to encounter significant friction.
Key Features and Market Utility
The primary appeal of the GRF Leading Edge lies in its ability to categorize price action into distinct zones:
- The Core Zone (Neutral): When price fluctuates between the inner bands, the market is typically in a consolidation phase or a low-momentum trend.
- The Extreme Zones (Reversal): When price touches or pierces the outermost red bands, the asset is considered statistically overextended. These zones represent high-probability areas for mean reversion or profit-taking.
- The Trend Corridors: Steady price action that "rides" the space between the inner and outer bands often signals a strong, sustainable trend.
Strategic Trading Applications
Integrating the GRF Leading Edge into your technical analysis provides a structured framework for decision-making:
- Mean Reversion Trading: On timeframes like the M15, traders look for "exhaustion" candles that touch the outer GRF bands. If a rejection candle forms at this leading edge, it serves as a powerful signal to trade back toward the central median.
- Volatility Breakouts: When the bands tighten (a "squeeze"), it indicates low volatility. A sharp break outside of the bands often precedes a massive directional move, allowing traders to enter early in a new trend.
- Dynamic Support And Resistance: Unlike horizontal lines, the GRF bands provide a fluid map of support and resistance. In a bullish trend, the inner bands often act as a "moving floor" where traders can look for dip-buying opportunities.
Why Use GRF Leading Edge Over Standard Tools?
Traditional indicators often lag behind rapid price shifts. The GRF Leading Edge is engineered to be more responsive to recent price history, reducing the "lag" that often leads to late entries. For scalpers and day traders, this responsiveness is the difference between catching a move and chasing it.
Conclusion
The GRF Leading Edge indicator is a powerhouse for traders who demand a visual representation of market limits. By defining the boundaries of "normal" versus "extreme" price action, it empowers you to trade with discipline and precision. Whether you are looking to fade extremes or ride emerging trends, the GRF Leading Edge provides the clarity needed to navigate today’s complex financial markets.
2 Downloads
Last Update:
Apr 29, 2026 13:47 PM
Published:
Jan 31, 2026 02:25 AM
Category: