Unlock Professional Precision with the Fractal Price Action Ppr Indicator
In the world of technical analysis, "noise" is the trader's greatest enemy. Markets rarely move in a straight line, and the constant fluctuation of intraday Price Action can lead to premature exits or poorly timed entries. The Fractal Price Action Ppr Indicator for MetaTrader is a specialized tool designed to filter out this static, highlighting the core pivot points that define Market Structure. By utilizing the mathematical power of fractals, this indicator identifies high-probability reversal zones with surgical precision.
The Logic of Fractals in Trading
A fractal is a geometric pattern that repeats at every scale. In trading, a fractal pattern consists of five consecutive bars where the middle bar possesses the highest high (a bearish fractal) or the lowest low (a bullish fractal). The Fractal Price Action Ppr takes this foundational concept and optimizes it for the modern MetaTrader environment.
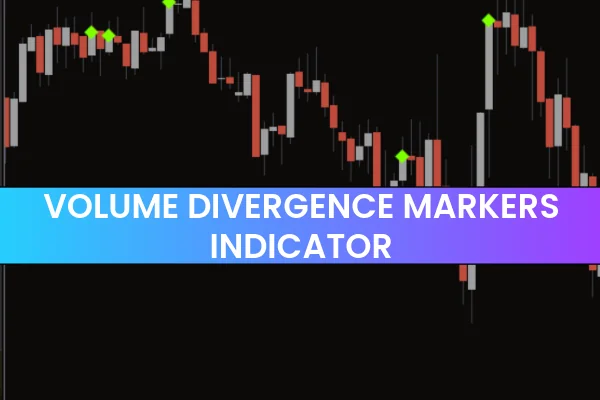
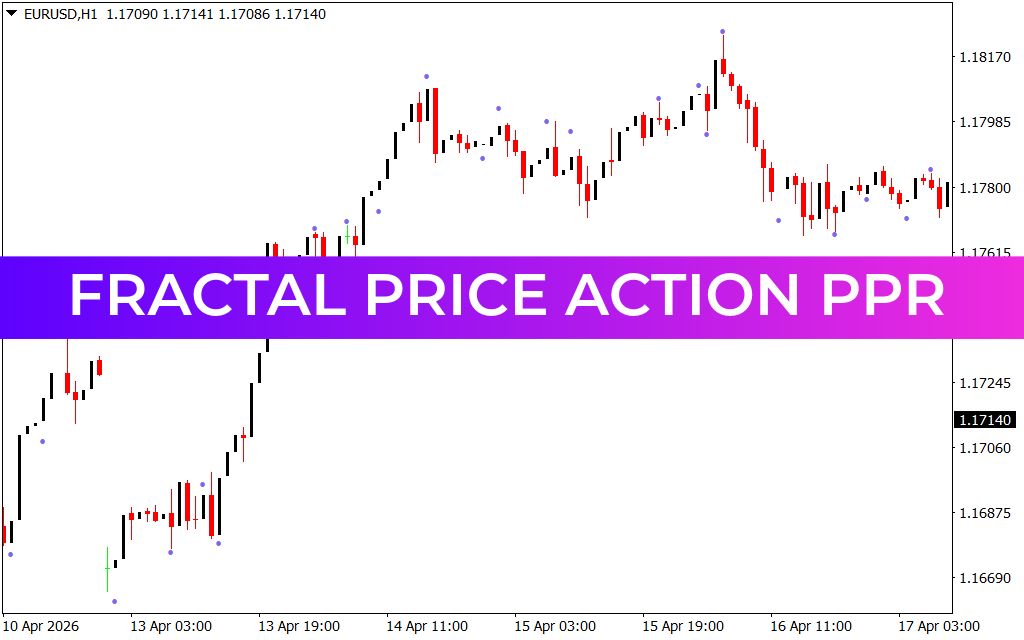
As shown in the EUR/USD H1 chart, the indicator places small, unobtrusive dots above and below the candles. These aren't just random marks; they represent significant structural "swing" points.
- Resistance Identification: Dots appearing above candles indicate where the market has found a temporary ceiling.
- Support Identification: Dots below candles highlight floors where buying pressure has historically stepped in.
Why Price Action Traders Choose PPR
"PPR" stands for Price Pivot Reversal. Unlike lagging indicators such as moving averages, which wait for price to move before reacting, the Fractal Price Action Ppr identifies the exact bar where the shift in momentum occurs. This "leading" nature allows traders to:
- Identify Breakouts: When a series of fractal dots is broken by a strong candle, it often signals the start of a massive trend expansion.
- Set Objective Stop-Losses: Fractals provide the perfect "natural" stop-loss levels. Placing a stop just behind the most recent fractal dot ensures you are protected by the market's own structural barriers.
- Enhance Multi-Timeframe Analysis: By seeing fractals on the H1 chart, a trader can understand the "Big Picture" while zooming into lower timeframes for an entry, ensuring they never trade against the dominant structural flow.
Implementation and Strategy
The beauty of the Fractal Price Action Ppr lies in its simplicity. It does not repaint, meaning once a fractal is formed and confirmed by the subsequent bars, it remains on the chart as a permanent historical reference. This makes it an ideal tool for backtesting and developing rule-based strategies.
For the best results, traders often look for "Fractal Clusters"—areas where multiple dots align at the same price level over time. This indicates a "hard" support or resistance zone that institutional players are defending. Whether you are a pure price action enthusiast or a system trader looking for a reliable filter, the Fractal Price Action Ppr provides the clarity needed to navigate the Forex markets with confidence and consistency.
9 Downloads
Last Update:
Apr 29, 2026 01:35 AM
Published:
Jan 31, 2026 18:56 PM
Category: