Predictive Technical Analysis: Mastering Markets with Fourier Extrapolation RSX
In the fast-moving world of Forex trading, the ability to anticipate future price movement is the ultimate competitive advantage. While most technical indicators are "lagging"—meaning they only reflect what has already happened—advanced mathematical tools allow traders to look ahead. The Fourier Extrapolation RSX for MetaTrader is a premier predictive indicator that combines the smoothing power of the RSX (Relative Strength Quality Index) with the mathematical forecasting of Fourier Transform theory.
What is Fourier Extrapolation RSX?
The Fourier Extrapolation RSX is a hybrid technical tool designed to identify cyclical patterns in market data and project them into the future. It consists of two primary components:
- The RSX Foundation: The RSX is a "noise-free" version of the standard RSI. It provides an exceptionally smooth momentum oscillator that avoids the erratic "jagged" movements common in lower-tier indicators.
- Fourier Transformation: This mathematical process decomposes complex Price Action into a series of simple sine waves. By identifying the dominant cycles within these waves, the indicator can "extrapolate" or project where the momentum is likely to go next.
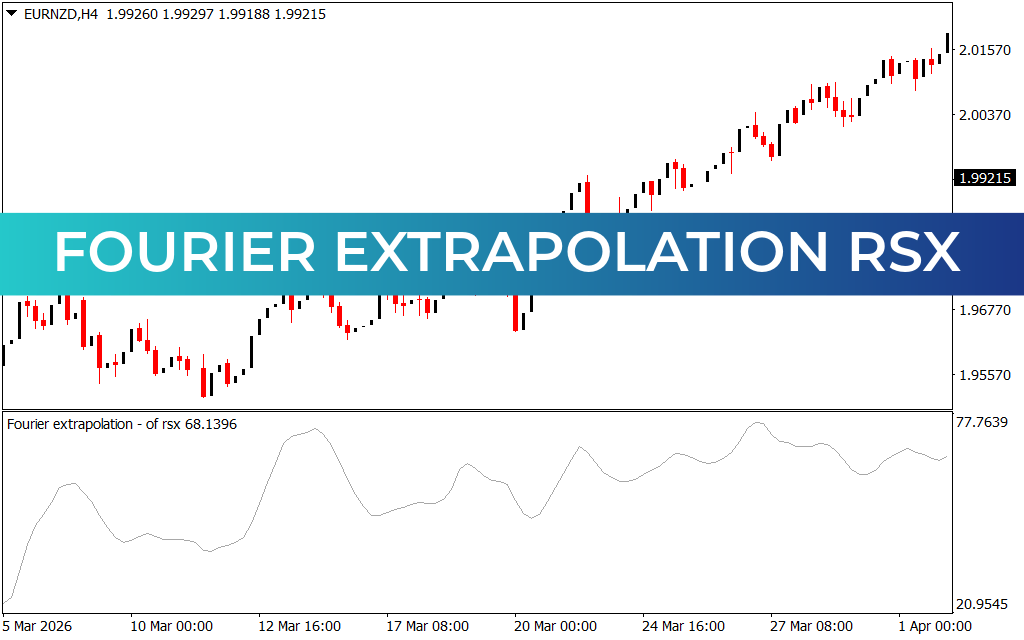
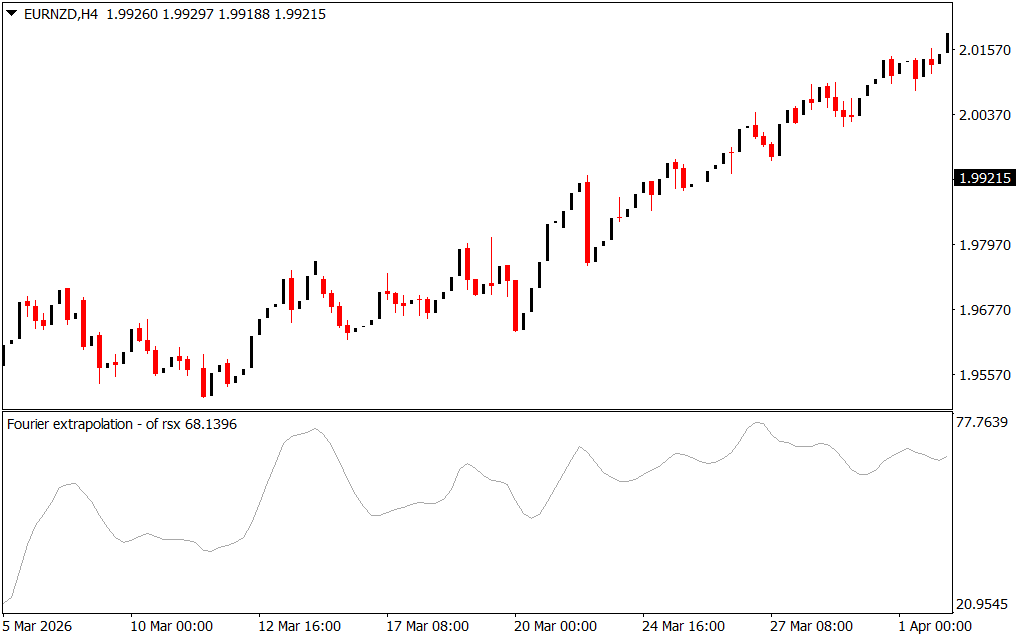
As seen in the EURNZD H4 chart, the indicator appears in a sub-window as a single, smooth oscillating line. Unlike standard oscillators that stop at the current candle, the Fourier Extrapolation continues to plot a "forecast" line, giving traders a visual representation of expected future momentum.
Decoding the Predictive Signals
The Fourier Extrapolation RSX is primarily used to identify trend exhaustion and upcoming reversals. Here is how professional traders interpret the visual data:
- Peak and Trough Identification: When the oscillator reaches the upper extremes (near the 77.7639 level in the provided chart), the market is considered overbought. Conversely, levels near the bottom (20.9545) signal oversold conditions.
- Cycle Alignment: In the EURNZD H4 analysis, notice how the oscillator's peaks align with the price peaks. The Fourier component analyzes these past correlations to project the next "wave," helping traders decide whether to hold a trend or prepare for a pullback.
- The Predictive "Tail": The most unique feature is the leading edge of the indicator. By watching the projected direction of the Fourier line, traders can anticipate a crossover or a change in momentum before the price action fully confirms it on the main chart.
Strategic Advantages on the H4 Timeframe
The H4 (four-hour) timeframe is the ideal environment for the Fourier Extrapolation RSX. Because H4 price action is driven by institutional cycles, the Fourier transform can identify repeatable patterns with high accuracy.
Traders often use this indicator to "time" their entries into a dominant trend. If the higher-timeframe trend is bullish and the Fourier RSX projects a bottoming cycle, it creates a high-probability "buy the dip" opportunity. Furthermore, its smoothed nature makes it an excellent filter for avoiding false breakouts during consolidation phases.
Conclusion
The Fourier Extrapolation RSX represents the pinnacle of mathematical forecasting in technical analysis. By stripping away market noise and identifying the underlying rhythms of price action, it transforms the way traders perceive the charts. Whether you are a swing trader on the H4 or a long-term investor, this indicator provides the clinical, forward-looking edge required for consistent profitability.
1 Download
Last Update:
Apr 25, 2026 17:04 PM
Published:
Feb 02, 2026 17:43 PM
Category: