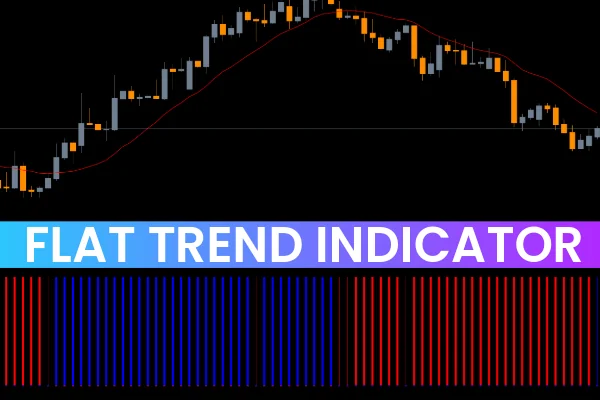
The Flat Trend Indicator for MT5 is a versatile trading tool designed to help traders easily identify market trends and consolidate phases. This free MT5 indicator combines **three moving averages—fast, medium, and slow—**and presents them as colored bars in a separate window below the price chart.
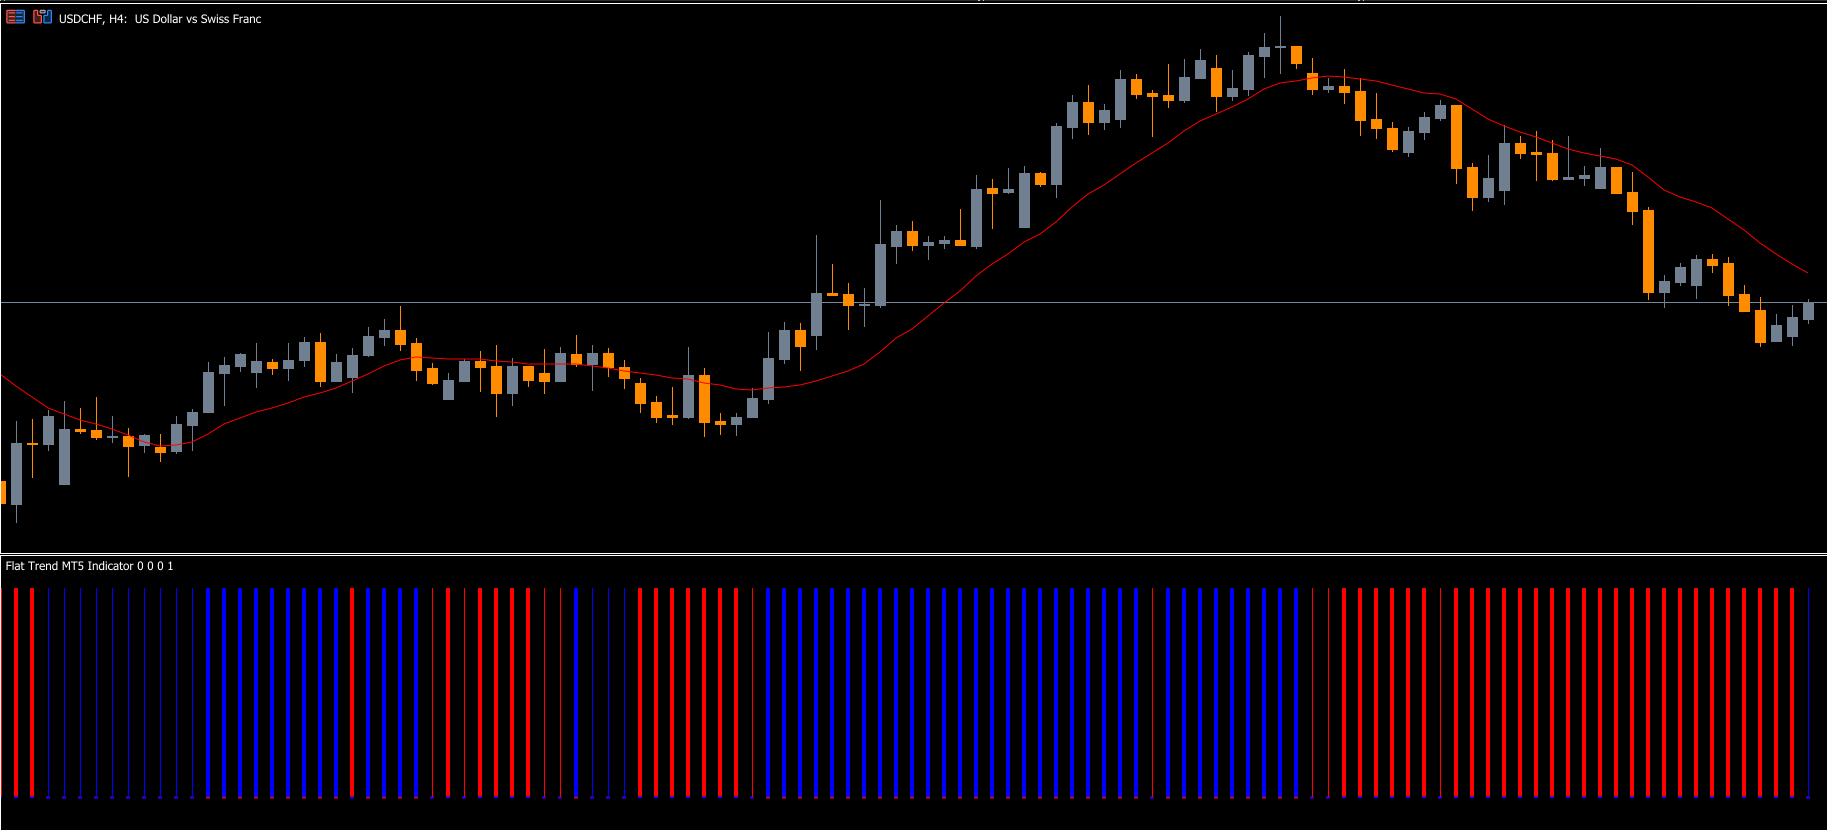
The indicator’s color-coding system helps traders determine market conditions:
Blue bars indicate a bullish market (buy signal).
Red bars indicate a bearish market (sell signal).
Thin blue or red bars signal market consolidation or a stable trend (neutral).
By visually simplifying trend direction, the Flat Trend Indicator is suitable for both novice and experienced traders, whether you trade Scalping strategies or longer-term trends.
How the Flat Trend Indicator Works
The Flat Trend Indicator relies on moving average confluence to determine market conditions. By combining a fast, medium, and slow moving average, it filters out market noise and highlights the prevailing trend.
The indicator displays its readings in a separate window beneath the price chart for clarity. You can customize the moving average settings to suit your trading strategy or risk preference.
Trading Signals Using the Flat Trend Indicator
Buy Signal
A buy signal occurs when the market transitions from a neutral range (thin bars) to a bullish trend (blue bars). To execute:
Wait for thin bars, signaling market consolidation.
Enter a buy trade when the bars change to blue.
Place a stop loss below the recent swing low.
Exit the trade when the bars turn from blue to thin or red, indicating a market reversal.
Sell Signal
A sell signal appears when the market transitions from a neutral or consolidating range to a bearish trend. To execute:
Observe thin bars to confirm the market is in a range.
Enter a sell trade when the bars turn red.
Place a stop loss above the recent swing high.
Close the position when the bars shift from red to thin or blue, signaling a Trend Reversal.
Flat or Stable Market
Thin blue or red bars indicate the market is consolidating, often referred to as a flat trend. During this period, it is prudent to avoid trading, as market momentum is minimal, and signals are less reliable.
Example Scenario
In a GBP/EUR H1 chart, the Flat Trend Indicator may show thin bars during consolidation. Once the bars turn blue, the indicator signals a buy opportunity. After entering, the market may rise significantly, such as a move of over 100 pips, demonstrating the strength of the trend signal.
Similarly, a change from thin bars to red indicates a sell opportunity. Price may drop by more than 50 pips after the signal, providing traders with a clear and actionable trading setup.
Advantages of the Flat Trend Indicator for MT5
Easy to Use: Color-coded bars make trend recognition straightforward.
Versatile Across Timeframes: Works on all MT5 chart timeframes, suitable for scalpers and trend traders.
Customizable: Traders can adjust moving average settings according to their preferred trading strategy.
Free Tool: Accessible to all traders without any cost.
Reduces Risk: Identifies flat markets to help traders avoid choppy conditions.
Conclusion
The Flat Trend Indicator for MT5 is an essential tool for any trader looking to simplify trend identification. By combining three moving averages and displaying color-coded bars, it clearly shows when to buy, sell, or avoid the market.
Blue bars: Buy
Red bars: Sell
Thin bars: Stay out
Whether you are a new trader learning market trends or an experienced trader executing precise entries, the Flat Trend Indicator provides a reliable visual representation of market momentum. It is particularly useful for scalping low spread pairs like EUR/USD and GBP/USD, but it works effectively in any market.
By following the color changes and understanding the market conditions, traders can improve their timing, reduce risk, and make better-informed trading decisions.
FAQ
5 Downloads
Published:
Nov 13, 2025 00:34 AM
Category: