Master the Momentum: A Guide to the Double CCI with SMA Cross Arrows
In the technical analysis landscape, the Commodity Channel Index (CCI) is revered for its ability to identify cyclical trends and overextended market conditions. However, a single CCI can often be volatile, producing "noise" that leads to premature entries. The Double CCI with SMA Cross Arrows is a sophisticated MT4 indicator that solves this by layering two distinct CCI periods with a Simple Moving Average (SMA) filter, providing traders with high-precision entry and exit signals.
What is the Double CCI with SMA Cross?
This indicator is a comprehensive momentum system that occupies a sub-window below your price chart. It utilizes a "Fast" CCI to capture immediate price impulses and a "Slow" CCI to verify the broader trend. To further refine these signals, a smoothed SMA line is applied to the CCI data.
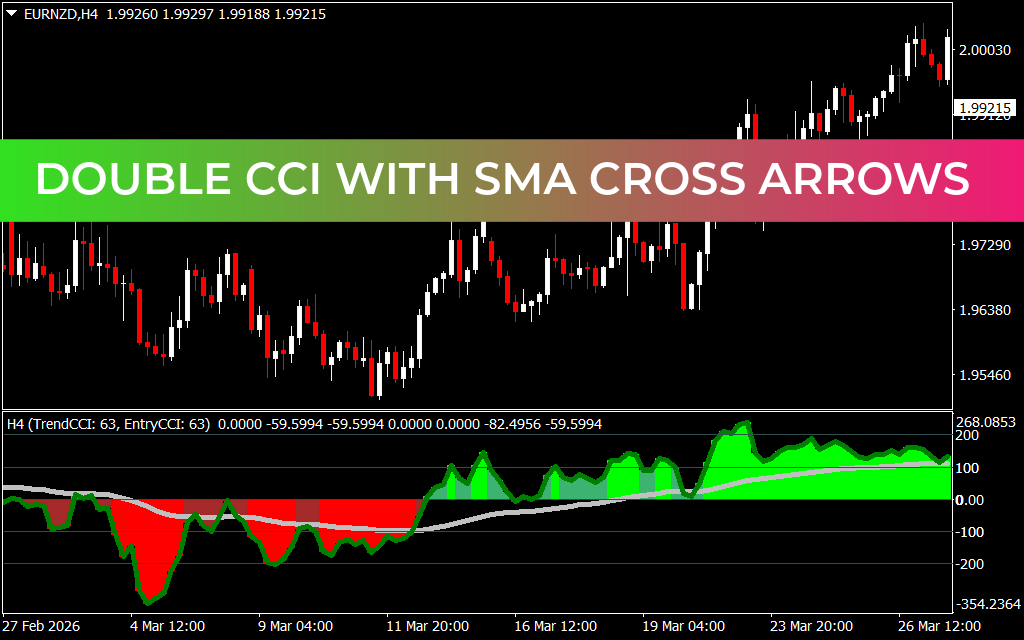
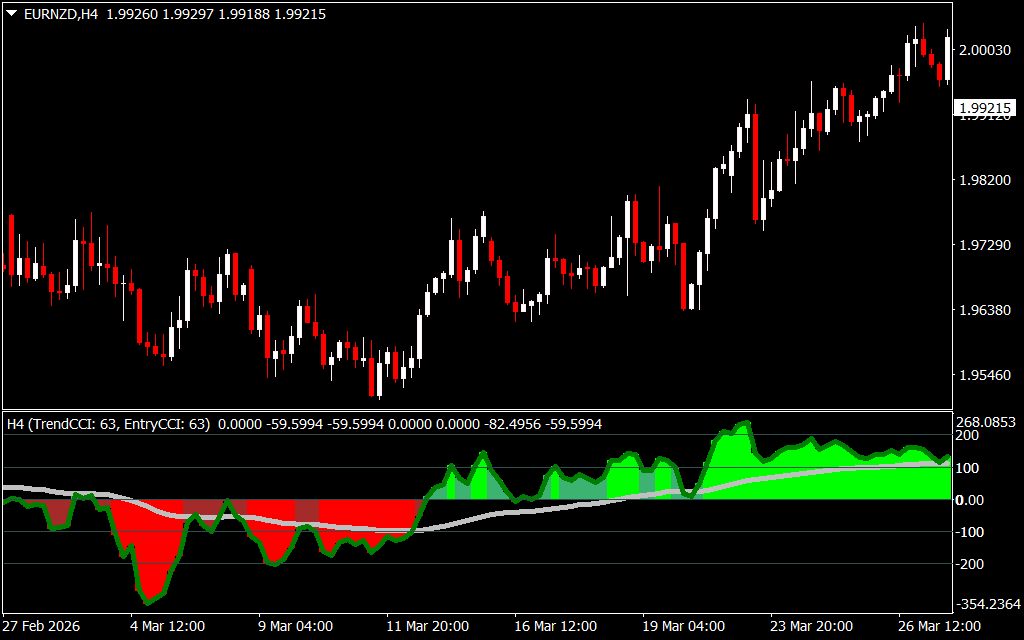
As seen in the EURNZD H4 analysis, the indicator transforms complex data into a clear, color-coded histogram. The green zones represent bullish momentum, while the red zones indicate bearish pressure. The "Cross Arrows" logic triggers when these momentum lines intersect the SMA, marking the exact moment a trend shift is mathematically confirmed.
Decoding the Visual Signals
The Double CCI with SMA Cross is designed for rapid visual interpretation, making it an ideal tool for both scalpers and swing traders.
- Bullish Momentum (Green Histogram): When the CCI lines cross above the zero-line and the SMA, the histogram turns green. This indicates that the buyers are in control. The taller the green bars, the stronger the upward surge, as seen in the sustained rally from 1.96380 toward 2.00030.
- Bearish Momentum (Red Histogram): When the CCI components drop below the zero-line and the SMA, the histogram turns red. This is a clear signal that selling pressure is dominant.
- The Overbought/Oversold Extremes: The indicator features levels at +100 and -100. When the green histogram peaks above +200, the market is overextended, warning traders to look for exit points or "Sell" arrow signals as the momentum inevitably reverts to the mean.
Strategic Advantage on the H4 Timeframe
The 4-hour (H4) chart is often considered the "Institutional Timeframe." The Double CCI with SMA Cross excels here because it filters out the minor price fluctuations seen on M1 or M5 charts.
Traders can use the Golden Cross—where the fast CCI crosses above the slow CCI and the SMA—as a definitive "Buy" signal. Conversely, a bearish crossover serves as an early warning to tighten stop-losses or close long positions. By aligning the color of the histogram with the slope of the SMA, traders can ensure they are always trading in the "path of least resistance."
Conclusion
The Double CCI with SMA Cross Arrows is a clinical momentum-tracking tool that brings professional-grade discipline to your trading. By combining two layers of trend analysis with a moving average filter, it eliminates guesswork and provides a visual roadmap of market strength. Whether you are navigating the volatile EURNZD or stable majors, this indicator provides the clarity needed to strike the market with confidence.
3 Downloads
Last Update:
Apr 25, 2026 17:06 PM
Published:
Feb 02, 2026 17:46 PM
Category: