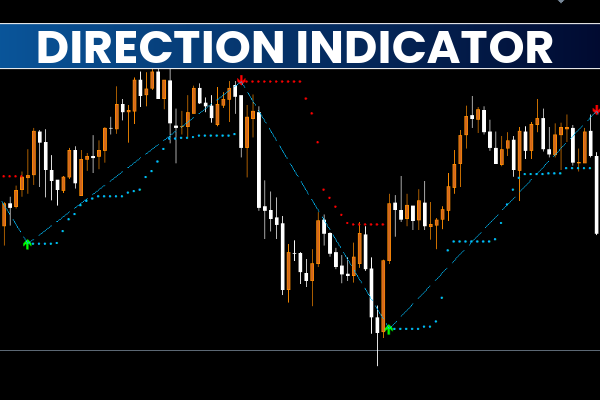
The Direction Indicator visually displays the market’s momentum and strength.
It provides traders with:
Green and red arrows to signal BUY and SELL opportunities.
Lines that continue with the trend, helping identify sustained moves.
Dots that mark potential support and resistance zones.
While the indicator can technically work across all timeframes, it performs best on higher timeframes (H1, H4, or Daily), where noise and false signals are minimized.
How to Use the Direction Indicator in MT4
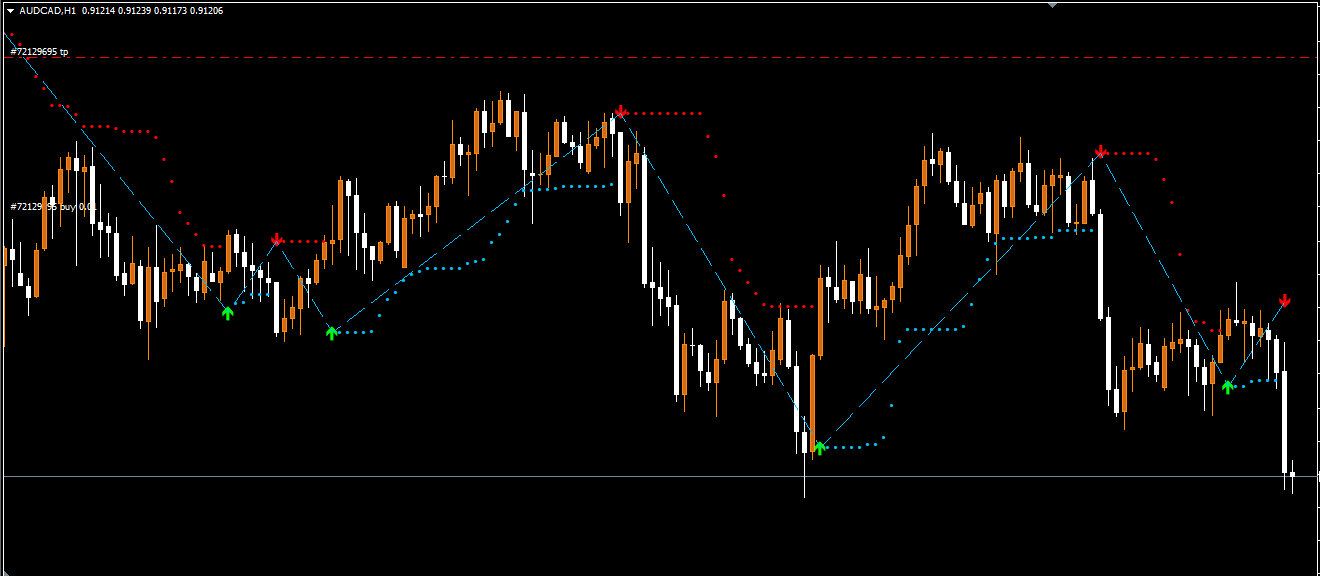
The example of the USD/JPY H4 chart shows how the Direction Indicator plots its signals.
Here’s how to interpret and trade them:
BUY Signal (Long Trade)
A green arrow appears below the price — this indicates a bullish signal.
The trendline shifts upward as the trend develops.
Dots form below the candles, acting as support levels.
Confirm the signal with other tools (e.g., RSI or Moving Average) before entering a trade.
SELL Signal (Short Trade)
A red arrow appears above the price — signaling a bearish trend.
The indicator’s line continues downward, showing sustained selling pressure.
Dots appear above the candles, working as resistance zones.
Combine this with other indicators or Price Action for confirmation.
Support and Resistance Dots
The dots play a key role in marking areas where the price might pause or reverse.
Traders can use them to trail stop losses or plan entries on pullbacks.
Trading Tips
The indicator may plot random arrows during volatile or low-volume periods, especially on shorter timeframes.
To improve accuracy, pair the Direction Indicator with trend filters such as the ADX, Moving Average, or MACD.
Avoid overtrading—wait for a confirmed arrow and dot alignment before taking a position.
Conclusion
The Direction Indicator for MT4 is a user-friendly tool that simplifies trend analysis. By combining arrows for signals, lines for continuation, and dots for support/resistance, it offers traders a complete picture of market direction.
Ideal for both beginner and intermediate traders, the indicator helps identify potential entry and exit zones with minimal effort. For best results, use it on higher timeframes and confirm its signals with other technical indicators or price action patterns.
FAQ
6 Downloads
Published:
Nov 07, 2025 09:22 AM
Category: