Master Market Structure with the Digital Fractals Price Indicator
In the complex ecosystem of Forex trading, the ability to identify turning points before they fully materialize is the ultimate advantage. While many traders rely on lagging oscillators, professional Price Action analysts often turn to the geometry of the market itself. The Digital Fractals Price Indicator for MT4 is a high-performance tool designed to detect these natural geometric repetitions, providing traders with clear, objective levels for support, resistance, and trend exhaustion.
What are Digital Fractals in Trading?
The concept of a fractal, popularized by Bill Williams, refers to a recurring pattern that repeats across all timeframes. In technical analysis, a basic fractal is a five-candle formation where the middle candle has the highest high or the lowest low of the group. The "Digital" evolution of this indicator takes it a step further by filtering out insignificant price spikes and labeling key structural highs and lows with precise price tags.
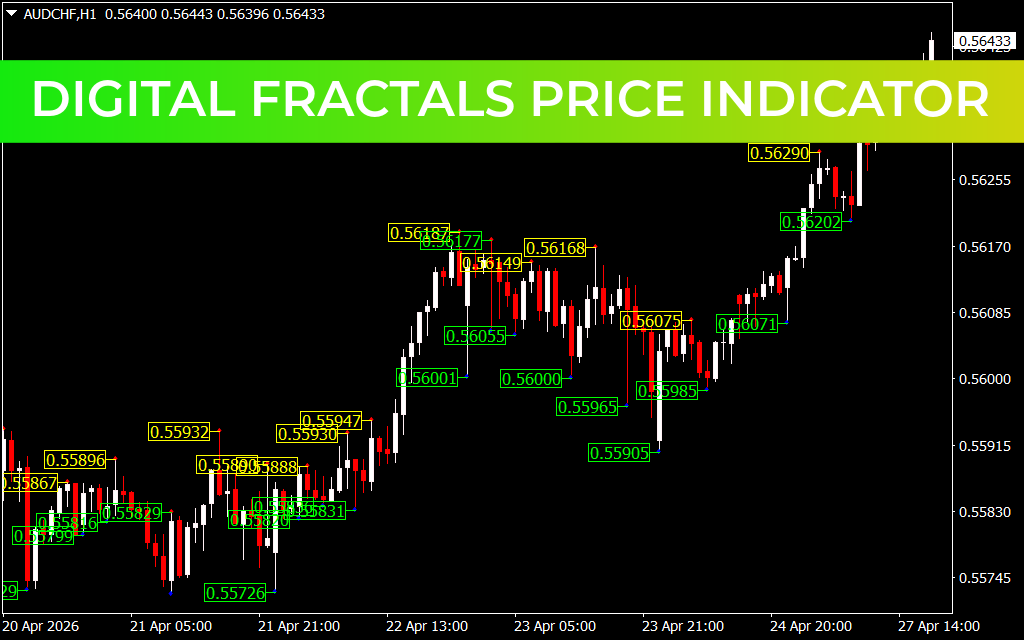
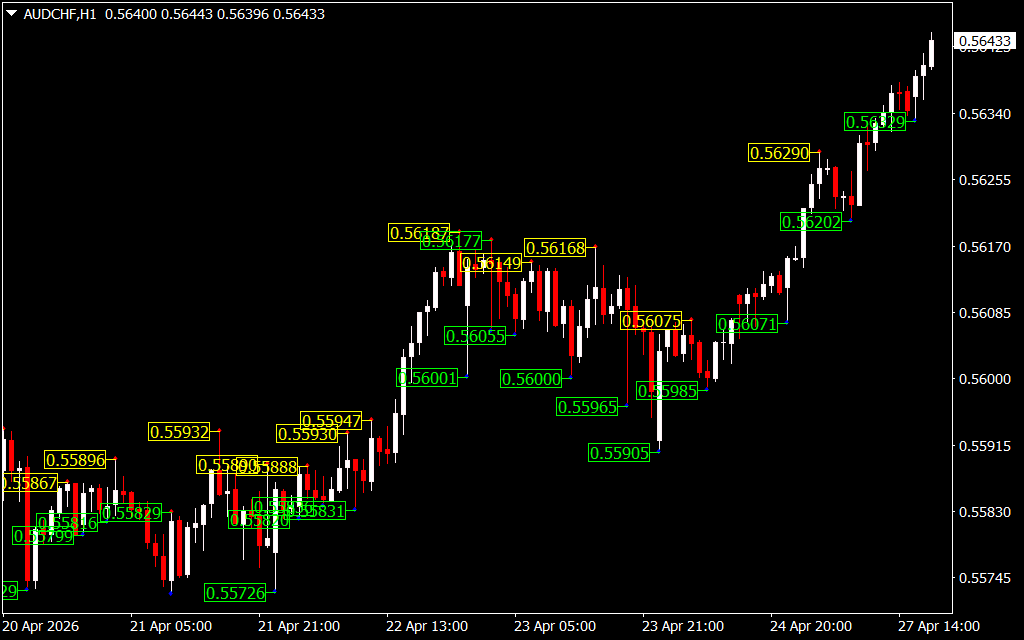
As seen in the provided AUD/CHF H1 chart, the Digital Fractals Price Indicator identifies:
- Swing Highs (Yellow Labels): These mark local resistance points where the upward momentum has stalled and sellers have entered the market.
- Swing Lows (Green Labels): These identify local support levels where buyers have historically stepped in to defend the price.
- Market Symmetry: By labeling these points, the indicator reveals the "stairs" of the market, helping you visualize whether the current trend is making higher highs or lower lows.
The Power of Precision Price Tagging
Unlike standard fractal arrows that can clutter a chart, the Digital Fractals Price Indicator provides the exact price level for each structural pivot. This is invaluable for several reasons:
- Objective Stop Loss Placement: Instead of guessing where to place your protective stop, you can place it exactly a few pips beyond the last digital fractal low (green label) for a long position.
- Accurate Target Setting: Use the previous yellow labels as logical "Take Profit" zones. These are the levels where price is most likely to encounter fresh selling pressure.
- Breakout Confirmation: When price closes above a recent yellow label or below a green label, it confirms a structural breakout, signaling a high-probability entry in the direction of the new move.
Strategic Application: Trend Following
The most effective way to use the Digital Fractals Price Indicator is to follow the Market Flow. On the H1 chart shown, notice the sequence of rising green labels. This creates a "trail" of rising support. As long as the market continues to print new green labels higher than the previous ones, the uptrend is intact. A break below a previous green label is your first warning that the trend may be ending.
For scalpers using lower timeframes, these digital labels act as a roadmap for "liquidity pockets." Price often returns to test these fractal levels before continuing its primary move, providing excellent "buy the dip" or "sell the rally" opportunities.
Conclusion
The Digital Fractals Price Indicator removes the subjectivity from price action trading. By automating the identification of significant highs and lows and providing real-time price labels, it allows you to trade with the confidence of a professional. Whether you are a swing trader or a scalper, this indicator is a foundational tool for understanding Market Structure.
9 Downloads
Last Update:
Apr 27, 2026 21:55 PM
Published:
Feb 01, 2026 12:52 PM
Category: