Maximize Market Insight with the Chart Overlay Indicator for MT4
In the modern trading environment, technical analysts are often overwhelmed by "indicator clutter." Opening multiple sub-windows for different oscillators and trend tools can compress Price Action until the most important data point—the price itself—becomes difficult to read. The Chart Overlay Indicator for MetaTrader 4 (MT4) is a professional-grade solution designed to streamline your workspace by projecting essential analytical data directly onto the main price chart. By integrating secondary data streams into a single visual plane, this indicator empowers traders to maintain focus on Market Structure while benefiting from advanced technical confirmation.
The Power of Integrated Technical Analysis
The primary objective of a Chart Overlay system is to provide confluence without distraction. Instead of looking down at a separate window to check momentum or volatility, the Chart Overlay Indicator brings that information to the candles. This "heads-up display" approach is essential for high-frequency traders and scalpers who cannot afford to take their eyes off price action for even a second.
As demonstrated in technical analysis across various timeframes, the Chart Overlay system provides a robust framework for professional decision-making:
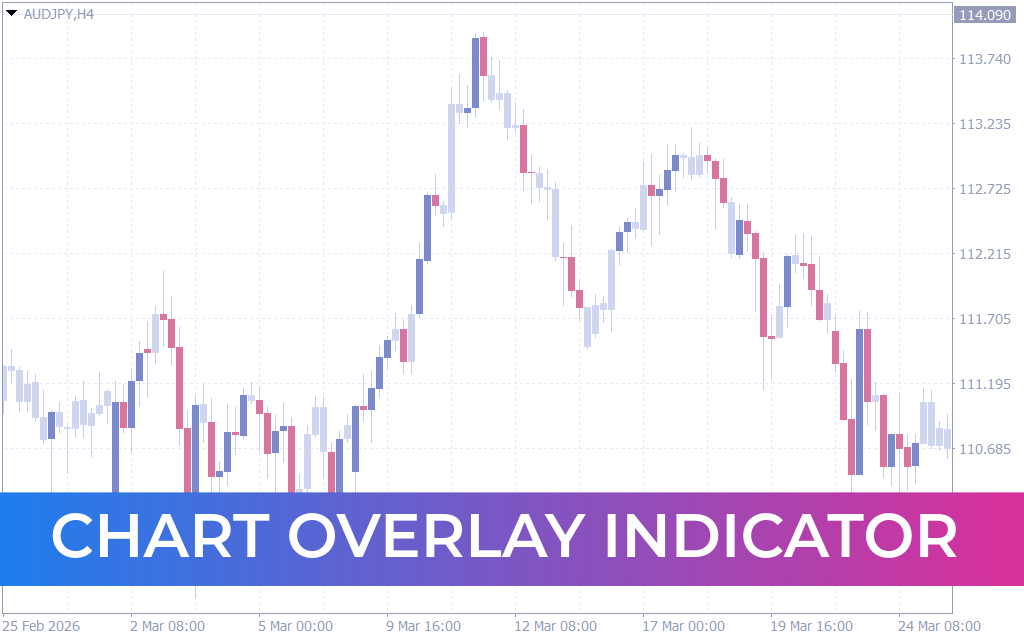
- Multi-Asset Projection: One of the most powerful features of the Chart Overlay is the ability to project a second currency pair or asset directly onto your current chart. As seen in correlation studies on the AUD/USD M15, overlaying a related asset like NZD/USD allows you to spot "inter-market divergences" in real-time—often a leading signal for major reversals.
- Trend & Volatility Envelopes: The indicator can overlay dynamic bands or channels, such as Moving Average Envelopes or Bollinger-style projections. This helps traders identify "exhaustion zones" where price has deviated too far from its mean, all without needing a cluttered sub-window.
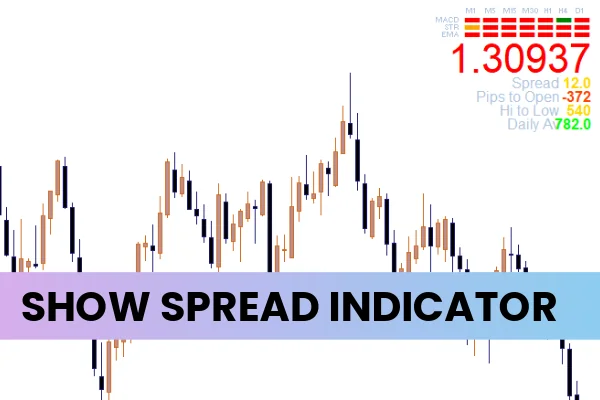
- Price Action Symbols: As shown on the AUD/USD M1 chart, the indicator can overlay specific symbols—such as red and blue dots—to mark proprietary signal triggers or fractal points. This provides an immediate "Go/No-Go" visual aid directly on the entry candle.
- Customizable Transparency: To ensure the primary candles remain visible, the indicator features granular control over line thickness, color, and transparency. You can create a "ghost" overlay that provides context without obscuring the current price trend.
Strategic Advantages for the Professional Trader
The Chart Overlay Indicator is an essential asset for those who value a clean, "institutional-style" terminal setup.
- Eliminate Screen Fatigue: By centralizing your data, you reduce the eye strain associated with scanning multiple windows. This leads to better discipline and more consistent execution over long trading sessions.
- Identify Market Correlation: Real-time overlaying of correlated pairs (like Gold vs. AUD/USD) reveals the hidden mechanics of the market, allowing you to trade with the "big picture" in mind.
- Enhanced Timeframe Analysis: Use the overlay to project a higher-timeframe trend onto your lower-timeframe execution chart. This ensures you are always trading in the direction of the "dominant" market flow.
- Optimized for Mobile & Small Screens: For traders using laptops or mobile devices, screen real estate is at a premium. The Chart Overlay Indicator maximizes this space by utilizing the main chart area for all necessary data.
Conclusion
The Chart Overlay Indicator for MT4 is a definitive tool for the organized, systematic trader. By bridging the gap between complex data and clear visualization, it empowers you to navigate the financial markets with unparalleled focus and professional-grade clarity. Elevate your MT4 terminal today and experience the efficiency of an integrated chart setup.
2 Downloads
Last Update:
Apr 17, 2026 14:39 PM
Published:
Feb 09, 2026 13:05 PM
Category: