Master Market Momentum with the CCI RSI Bar Indicator
Navigating the complexities of the Forex market requires tools that can distill vast amounts of data into actionable insights. Many traders struggle with "analysis paralysis," trying to reconcile conflicting signals from multiple oscillators. The CCI RSI Bar indicator is a sophisticated technical solution designed to solve this problem by merging two of the most powerful momentum tools into a single, easy-to-read visual interface.
What is the CCI RSI Bar?
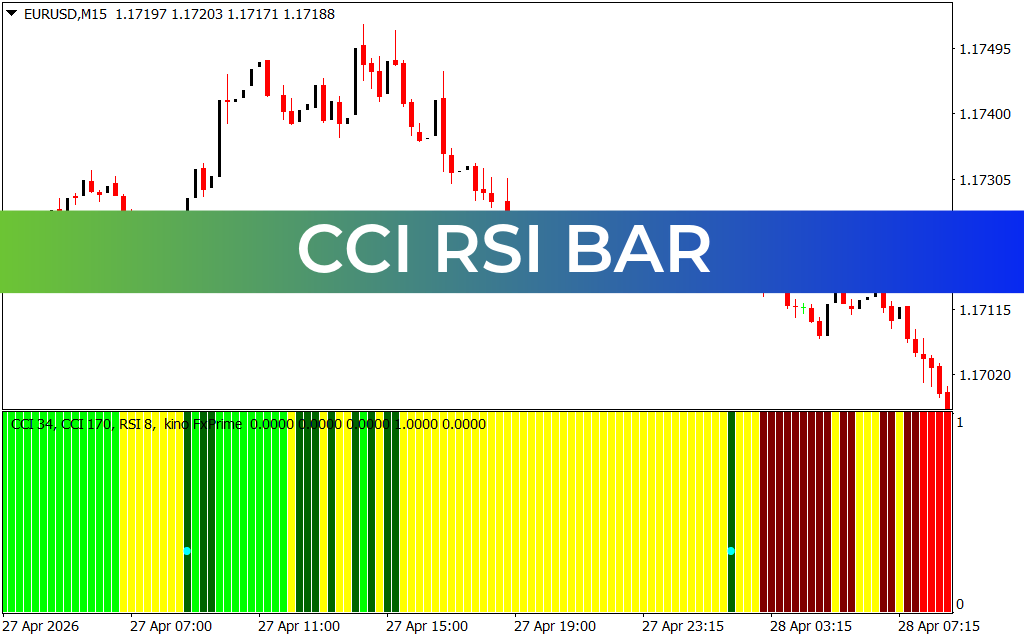
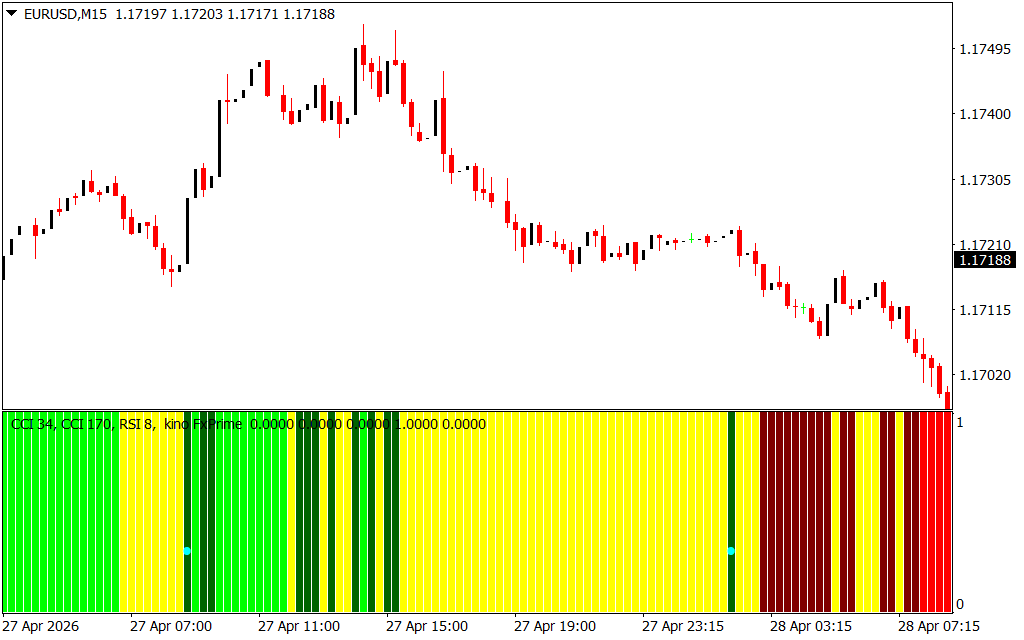
The CCI RSI Bar—as seen in the provided EUR/USD M15 chart—is a trend-following histogram indicator that occupies a sub-window of your trading platform. It functions as a powerful "confluence engine," calculating the mathematical agreement between the Commodity Channel Index (CCI) and the Relative Strength Index (RSI). Instead of forcing you to watch multiple lines crossing over one another, this indicator converts that complex data into color-coded vertical bars that represent the current market state in real-time.
How the Color Logic Works
The strength of the CCI RSI Bar lies in its visual simplicity. By assigning specific colors to market conditions, it allows traders to identify the dominant trend at a single glance:
- Bright Green & Dark Green: These bars represent strong bullish momentum. When both the CCI and RSI are aligned upward, the indicator turns green, signaling a high-probability "Buy" environment.
- Red & Maroon: These bars indicate intense bearish pressure. This is the "Sell" zone, where the asset is experiencing significant downward momentum.
- Yellow: Yellow bars signal market indecision or a "neutral" zone. This often occurs during consolidation phases or before a major Trend Reversal, warning traders to stay on the sidelines or wait for a confirmed breakout.
Trading Strategy: Precision Scalping and Day Trading
In the EUR/USD chart provided, the CCI RSI Bar excels at identifying the exact transition points between market phases. For instance, notice how the bars transition from green to yellow as the price tops out, followed by a shift to red as the bearish trend accelerates. This allows traders to stay in a winning trade for as long as the momentum remains, and exit immediately when the color shifts to yellow or red.
For scalpers using the M15 timeframe, this indicator acts as a powerful filter. By only taking trades that align with the color of the CCI RSI Bar, you significantly reduce the risk of entering "fakeouts" or trading against the prevailing trend.
Integration and Compatibility
The CCI RSI Bar is optimized for the MT4 and MT5 platforms and is lightweight enough to be used alongside other indicators like Moving Averages or Bollinger Bands. Its data-driven approach to momentum makes it an essential tool for anyone looking to professionalize their technical analysis and achieve consistent results in the Forex, commodity, or crypto markets.
3 Downloads
Last Update:
May 03, 2026 00:57 AM
Published:
Jan 28, 2026 22:45 PM
Category: