Master Price Velocity with the Cauchy Derivative Indicator
In the pursuit of market mastery, traders often struggle with the "lag" inherent in traditional moving averages. By the time a standard crossover occurs, a significant portion of the move is often already over. To combat this, advanced technical analysts turn to digital signal processing and calculus-based tools. The Cauchy Derivative Indicator is a premier example of this innovation, designed to measure the instantaneous rate of change in price with surgical precision.
What is the Cauchy Derivative Indicator?
The Cauchy Derivative Indicator is a sophisticated momentum tool for the MetaTrader platform that utilizes the Cauchy distribution and derivative mathematics to analyze price velocity. Unlike basic oscillators that simply track price location relative to a range, this indicator tracks the speed of price movement. It identifies how quickly a trend is accelerating or decelerating, providing a "leading" look at potential market turns.
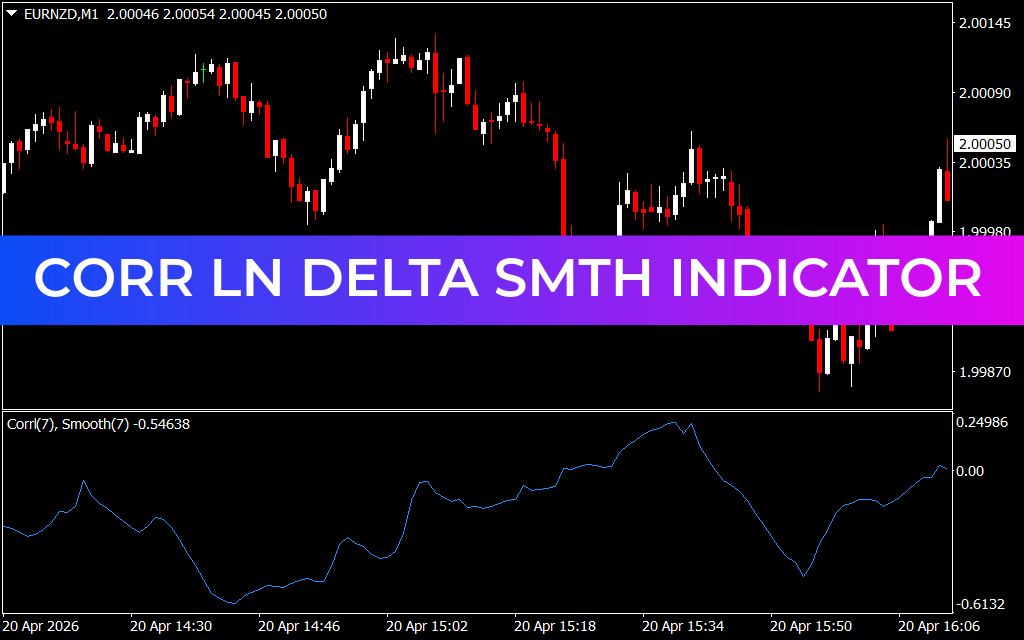
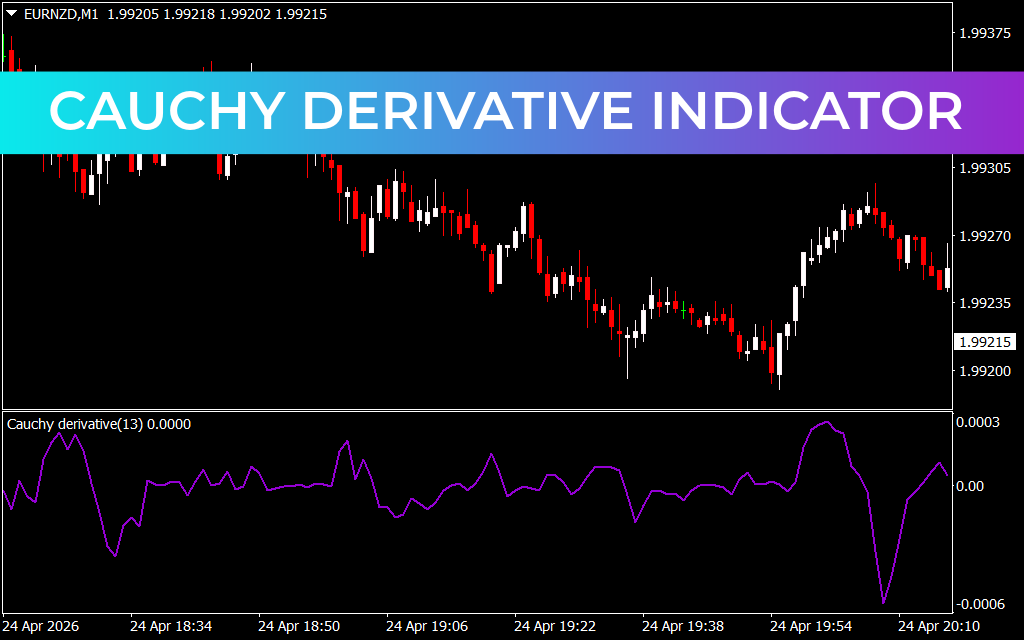
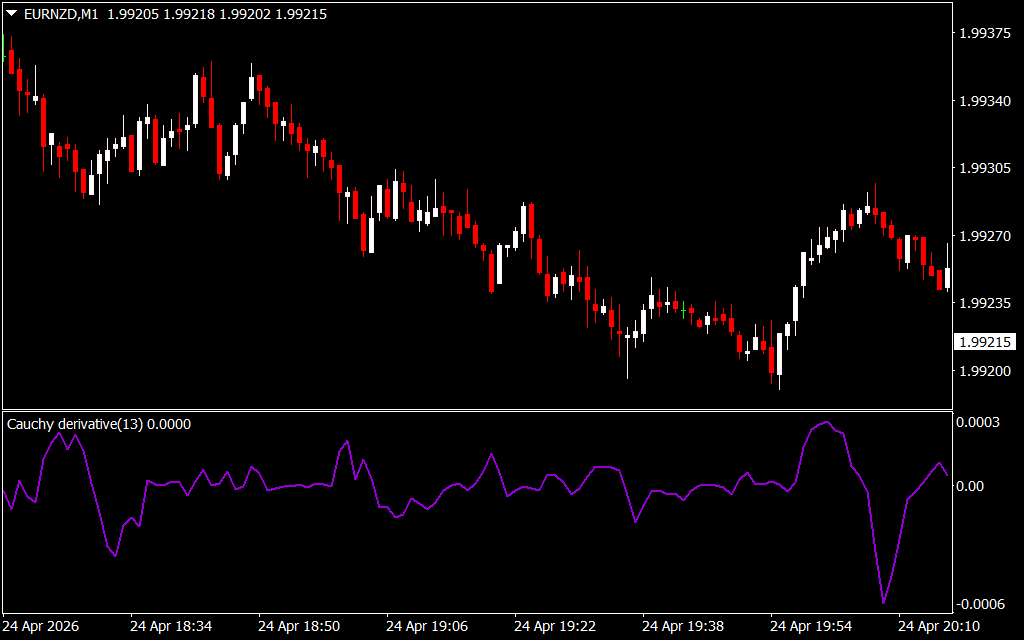
As shown in the EURNZD M1 chart, the indicator appears as a violet oscillating line in a sub-window. It fluctuates around a central zero level, representing the equilibrium point where price velocity is neutral.
The Power of "Rate of Change" Analysis
The core strength of the Cauchy Derivative lies in its ability to highlight market exhaustion before it becomes obvious on the price chart.
- Acceleration: When the violet line moves sharply away from the zero level, it indicates that the current trend is gaining speed. This is the ideal time for trend-followers to hold their positions.
- Deceleration (The Warning): If price continues to make new highs but the Cauchy Derivative begins to curve back toward the zero line, it signals that the "velocity" is dropping. This divergence is a powerful early warning that the trend is losing steam.
- Zero-Line Crossings: A crossing of the zero level indicates a shift in the dominant momentum, often serving as a highly accurate signal for intraday reversals or the start of a new trend cycle.
Strategic Advantages for High-Frequency Traders
Because the Cauchy Derivative is based on the rate of change, it is exceptionally sensitive to market shifts, making it a favorite for scalpers and day traders working on lower timeframes like the M1 or M5.
- Noise Reduction: Despite its sensitivity, the Cauchy-based algorithm filters out minor market "jitter," ensuring that the signals you receive are based on significant momentum shifts rather than random volatility.
- Precise Exit Timing: Most traders lose profit by exiting too late. By watching for the Cauchy line to peak and begin its return to center, you can exit your trades at the moment of maximum velocity.
- Confluence with Price Action: When paired with Support And Resistance levels, the indicator becomes a formidable confirmation tool. A bounce off a major support level accompanied by a sharp upward turn in the Cauchy Derivative provides a high-confidence entry signal.
Conclusion
The Cauchy Derivative Indicator represents the intersection of advanced mathematics and practical trading. It provides a level of clarity regarding price velocity that standard indicators simply cannot match. By integrating this tool into your MetaTrader setup, you gain the ability to see the "force" behind the candles, allowing you to trade with the speed and precision of a professional.
1 Download
Last Update:
Apr 25, 2026 22:54 PM
Published:
Feb 02, 2026 13:13 PM
Category: