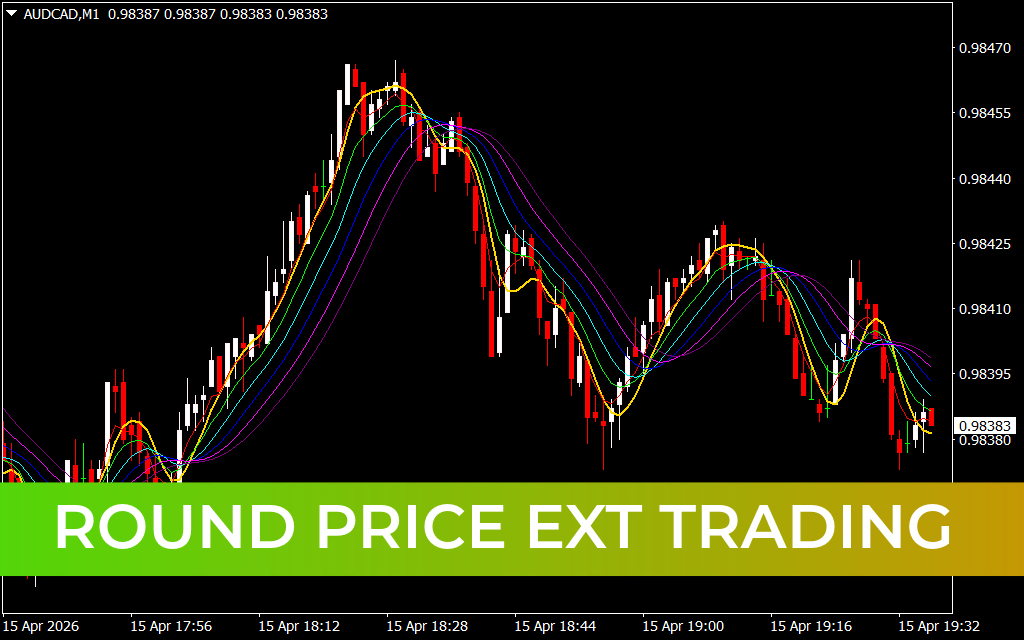
The provided charts showcase various technical setups, including multi-tier volatility bands, Step RSI momentum oscillators, and Volume Spread Analysis (VSA) histograms. The Candle Difference Indicator Forest is another unique utility that focuses on Price Action relationships and relative currency strength to help traders spot high-probability momentum shifts.

Mastering Price Dynamics with the Candle Difference Indicator Forest
In the competitive landscape of Forex trading, understanding the "velocity" of price is crucial. Most standard indicators tell you where the price is, but few explain the strength behind the movement relative to historical averages or other currency pairs. The Candle Difference Indicator Forest is a specialized technical tool for MetaTrader 4 (MT4) designed to visualize these subtle differences in candle dynamics and market sentiment.
What is the Candle Difference Indicator Forest?
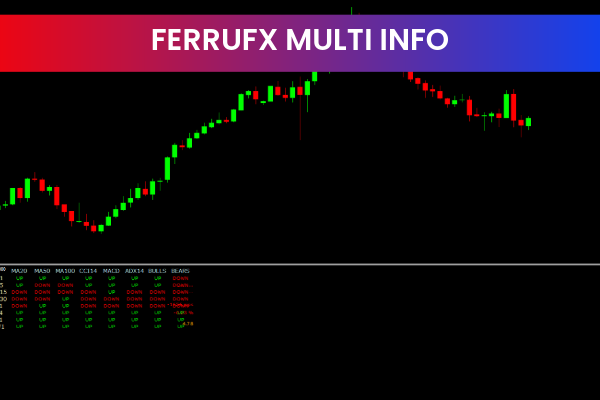
This indicator belongs to a class of "dashboard" and "overlay" utilities that analyze the internal structure of price candles. It calculates the difference between opening and closing prices, high/low spreads, and relative body size across multiple candles. By presenting this data in a "Forest" or list format, it allows traders to see whether the market is currently expanding (trending) or contracting (consolidating).
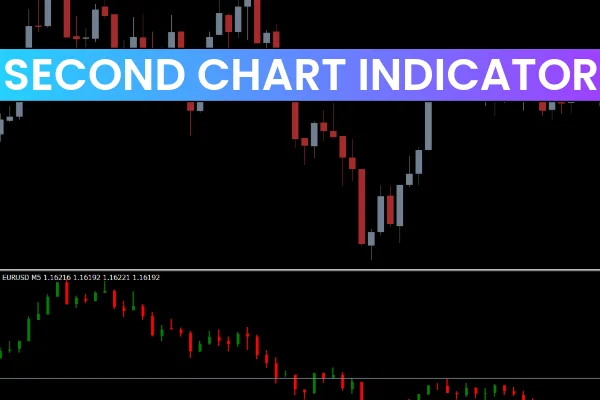
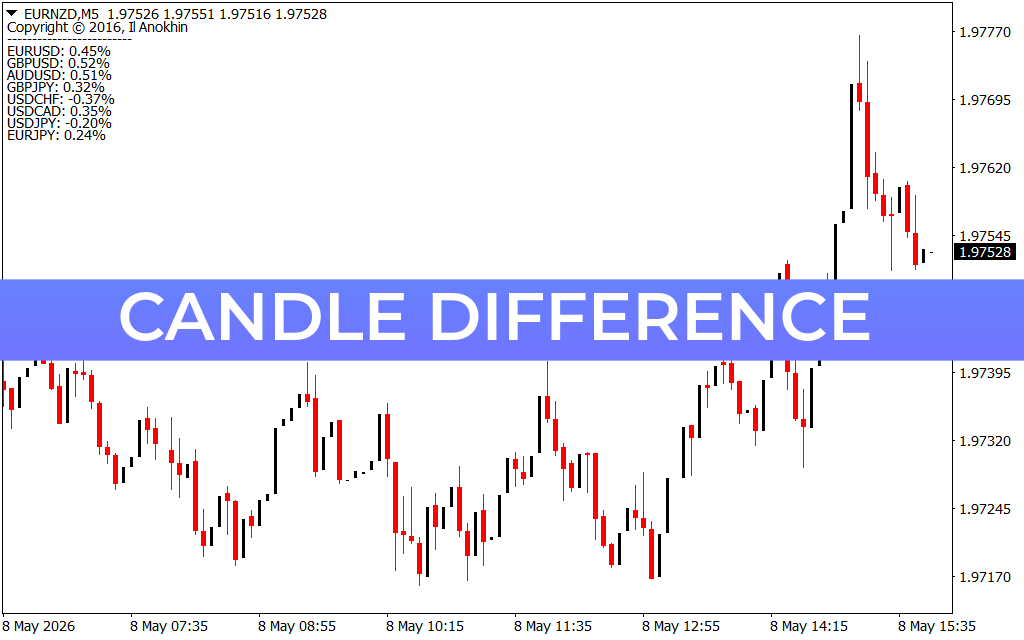
As seen in the accompanying M5 chart, this setup often includes a Currency Strength Overlay. This additional data point compares the percentage change of major pairs like EURUSD, GBPUSD, and USDJPY in real-time, providing a "top-down" view of which currencies are leading the market.
Key Features and Strategic Advantages
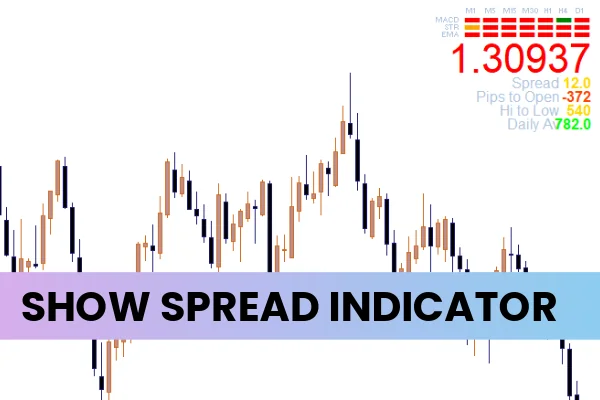
- Volatility Analysis: The indicator highlights when candle "spreads" are increasing, which is a precursor to a major breakout.
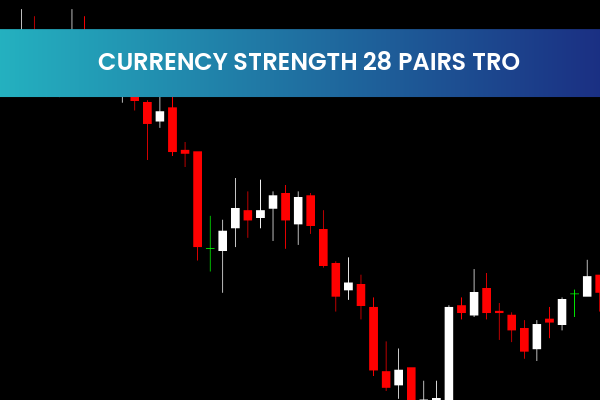
- Relative Strength Comparison: By viewing the percentage performance of various pairs simultaneously, traders can identify the strongest currency to buy and the weakest to sell, maximizing the "edge" in a trade.
- Filter for Range Markets: During periods of low "Candle Difference," the indicator warns traders to stay on the sidelines, preventing the "death by a thousand cuts" that occurs in sideways markets.
- Multi-Timeframe Insights: While efficient on the 5-minute (M5) chart for day trading, its ability to track percentage changes across the board makes it an essential tool for swing traders looking for daily bias.
How to Trade with the Indicator Forest
The most effective way to use this tool is for Confluence. If you are looking at a bullish setup on the EURNZD, you check the "Forest" dashboard. If the EUR is showing a positive percentage (+0.45%) while the NZD is lagging, you have a fundamental momentum confirmation for your technical entry.
Traders often look for "outliers"—pairs that are moving significantly more than others. When the Candle Difference starts to spike on a specific pair while others remain flat, it signals that institutional volume is entering that specific market. This allows you to follow the "Smart Money" before the move becomes obvious to the retail crowd.
SEO Meta Description
1 Download
Last Update:
May 08, 2026 19:01 PM
Published:
Jan 25, 2026 21:58 PM
Category: