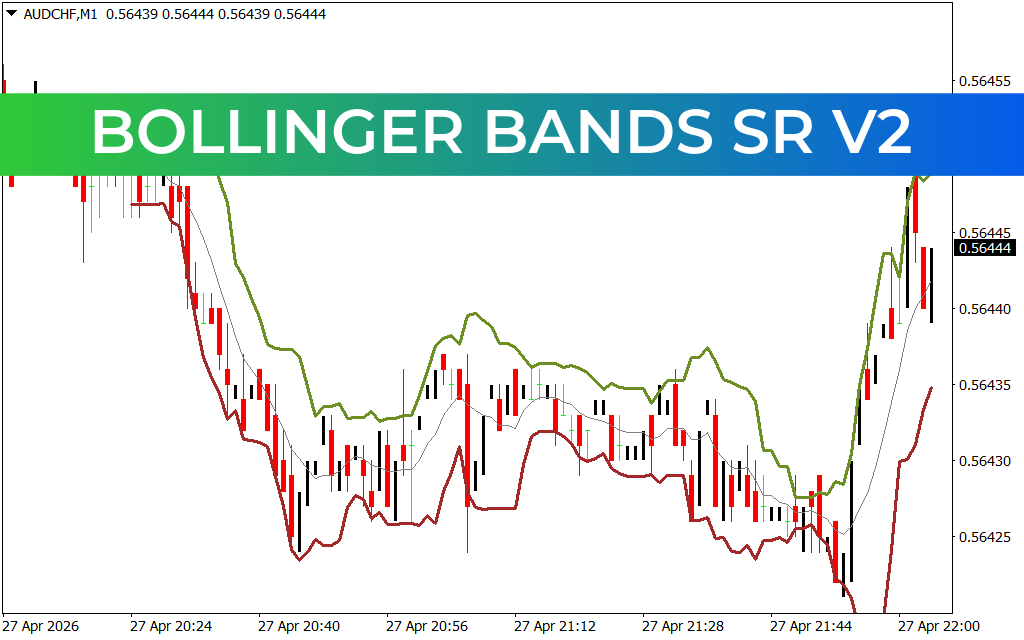
Master Volatility with the Bollinger Bands Sr V2 Indicator for MT4
In the realm of technical analysis, few tools are as revered as Bollinger Bands for their ability to visualize market volatility and potential price extremes. However, standard versions often lack the structural depth required by professional intraday traders. The Bollinger Bands Sr V2 Indicator for MetaTrader 4 is a high-performance evolution of this classic tool, engineered to provide a clearer, more responsive framework for identifying breakouts, reversals, and mean reversion opportunities.
What is the Bollinger Bands Sr V2 Indicator?
At its core, the Bollinger Bands Sr V2 consists of a middle moving average and two outer bands that expand and contract based on standard deviation. What sets the "Sr V2" version apart is its proprietary smoothing algorithm and enhanced visual clarity. It acts as a dynamic "envelope" for Price Action, defining the mathematical boundaries of current market behavior.
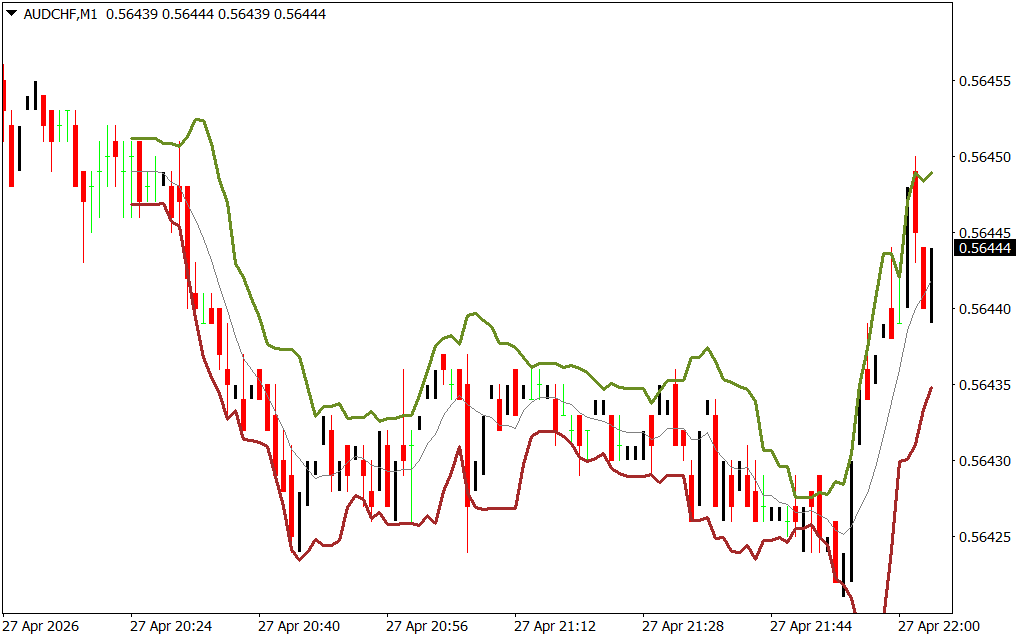
As shown in the provided AUD/CHF M1 chart, the indicator creates a distinct visual channel.
- The Upper Band: Represents the overbought boundary where price momentum typically faces resistance.
- The Lower Band: Represents the oversold boundary where buying pressure often emerges.
- The Median Line: Functions as the primary trend filter and equilibrium point for the pair.
Why Intraday Traders Prefer the V2 Version
Trading on lower timeframes like the M1 or M5 requires indicators that can filter out "market noise" without losing sensitivity to real volatility shifts. The Bollinger Bands Sr V2 excels in these conditions by:
- Identifying the "Squeeze": When the bands tighten significantly, it signals a period of low volatility. In the AUD/CHF example, notice how the bands narrow before a sharp expansion move. This "squeeze" is a premier leading indicator for an impending breakout.
- Visualizing Volatility Breakouts: When a candle closes outside the upper or lower band, it signals a volatility expansion. Professional traders use the V2 version to catch the early stages of these momentum bursts.
- Dynamic Support And Resistance: Unlike static horizontal lines, these bands move with the market. On the AUD/CHF chart, you can see price "walking the bands" during a sustained move, providing a clear visual trail for trailing stop-losses.
Strategic Application: The Mean Reversion Setup
The most powerful way to utilize the Bollinger Bands Sr V2 is the Mean Reversion Strategy.
- The Setup: Look for price to touch or pierce the outer bands while the bands themselves are relatively flat or beginning to curve inward.
- The Entry: In the provided chart, as price dips toward the lower brown band and begins to reject that level, it creates a high-probability "Buy" signal targeting the median line.
- The Confirmation: Use the slope of the median line to confirm the trade direction. A rising median line suggests that bullish mean reversion trades have a higher probability of success.
Conclusion
The Bollinger Bands Sr V2 Indicator is an essential upgrade for any MT4 user who relies on volatility-based strategies. By providing a mathematically superior view of price boundaries, it allows traders to enter the market with precision and manage risk with confidence. Whether you are an expert scalper or a trend-following swing trader, the Sr V2 version offers the structural clarity needed to master modern market movements.
6 Downloads
Last Update:
Apr 28, 2026 01:06 AM
Published:
Feb 01, 2026 04:12 AM
Category: