Mastering Volatility: A Deep Dive into the BB High Low Indicator
In the fast-paced world of Forex trading, clarity is the ultimate currency. Traders are constantly searching for tools that can filter out market noise and highlight high-probability entry and exit points. Among the plethora of technical indicators available, the BB High Low Indicator stands out as a sophisticated evolution of standard volatility bands, designed to help traders capitalize on price extremes and trend shifts.
Understanding the BB High Low Mechanism
The BB High Low indicator is rooted in the logic of Bollinger Bands, but with a specialized focus on the relationship between Price Action and dynamic support/resistance. While standard bands use a simple moving average as a baseline, the BB High Low often incorporates refined smoothing techniques to provide a "cleaner" look at the market's boundaries.
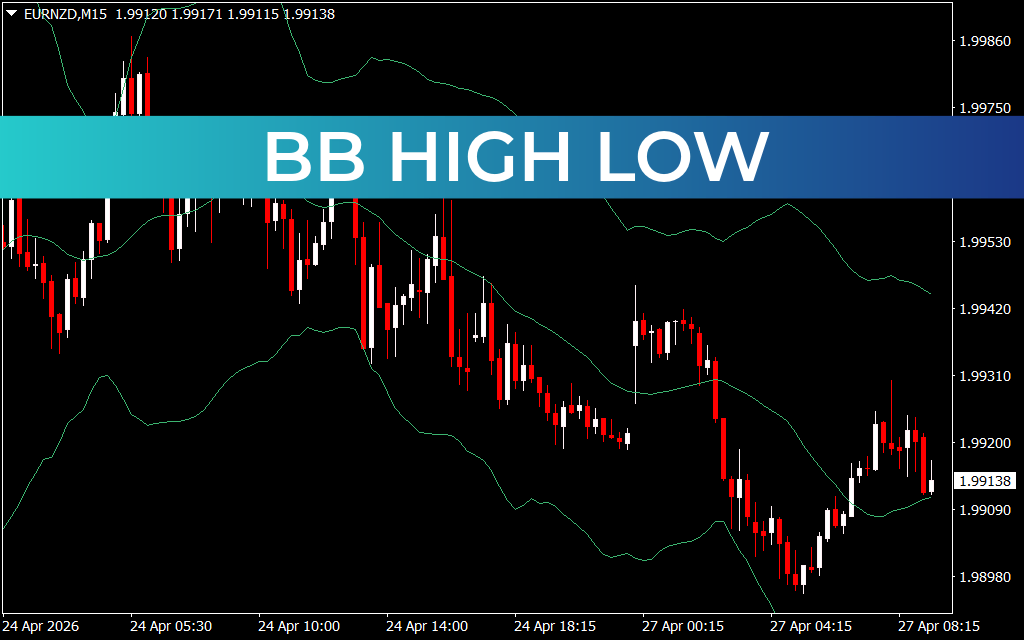
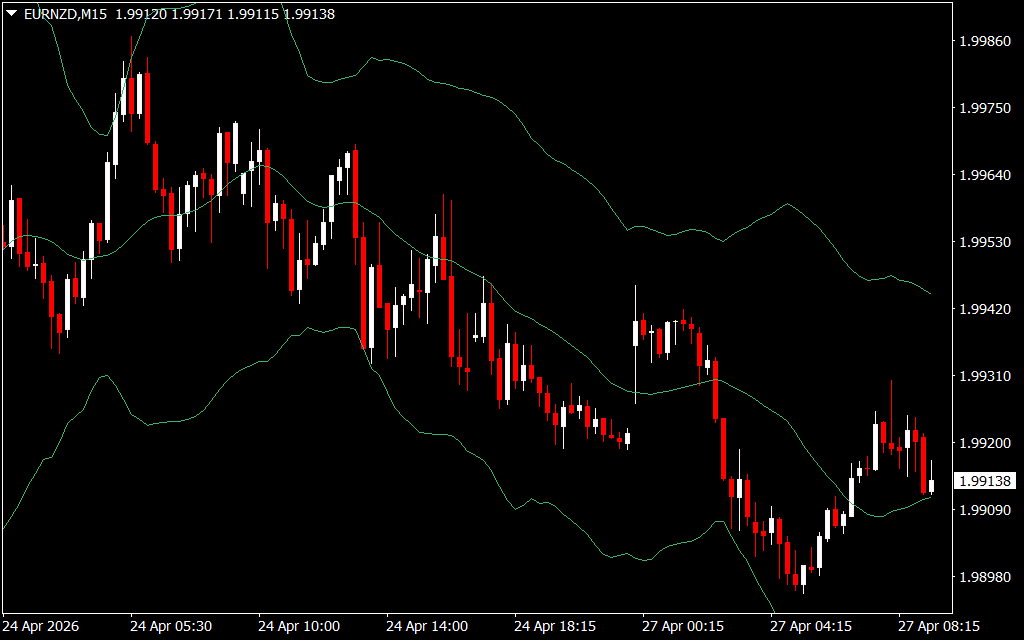
As seen in the EURNZD M15 chart, the indicator creates a visual channel. When price interacts with the upper or lower boundaries, it signals that the market is reaching a state of overextension. In a trending market, these bands act as a guide for "walking the bands," whereas, in a ranging market, they serve as ideal zones for mean-reversion trades.
Key Trading Strategies
To get the most out of the BB High Low indicator, traders typically employ two primary methodologies:
- The Mean Reversion Play: When the price touches or pierces the outer bands and follows up with a reversal candle (like a pin bar or engulfing pattern), it suggests a move back toward the midline. This is highly effective in sideways markets.
- The Trend Riding Approach: In a strong trend, price often hugs the outer band. A close outside the band can signal a surge in momentum, allowing traders to enter in the direction of the breakout while using the midline as a trailing stop-loss level.
Why Use the BB High Low?
The primary advantage of this indicator is its adaptability. Whether you are Scalping the 1-minute chart or swing trading the daily timeframes, the BB High Low adjusts its width based on current market volatility. This ensures that your profit targets and stop losses are always in sync with the current market environment. By integrating this tool into a broader trading plan—alongside RSI or MACD for divergence—traders can significantly increase their "edge" in the markets.
2 Downloads
Last Update:
Apr 27, 2026 12:23 PM
Published:
Feb 01, 2026 20:31 PM
Category: