Unlock Market Precision with the Bars Indicator for MetaTrader
In the high-stakes world of financial trading, the ability to interpret Price Action with speed and accuracy is the ultimate competitive advantage. While standard candlestick charts provide the raw data, they often contain "market noise" that can obscure the true underlying trend. The Bars Indicator is a sophisticated technical analysis tool designed to streamline your visual experience, providing a cleaner, more disciplined perspective on market movements directly within your MetaTrader platform.
What is the Bars Indicator?
The Bars Indicator is a specialized charting overlay that enhances the traditional bar chart format. Unlike standard OHLC (Open, High, Low, Close) bars that can appear cluttered on lower timeframes, this indicator utilizes advanced color-coding and smoothing algorithms to highlight the dominant market sentiment. It transforms your price chart into a highly readable map of buyer and seller exhaustion points.
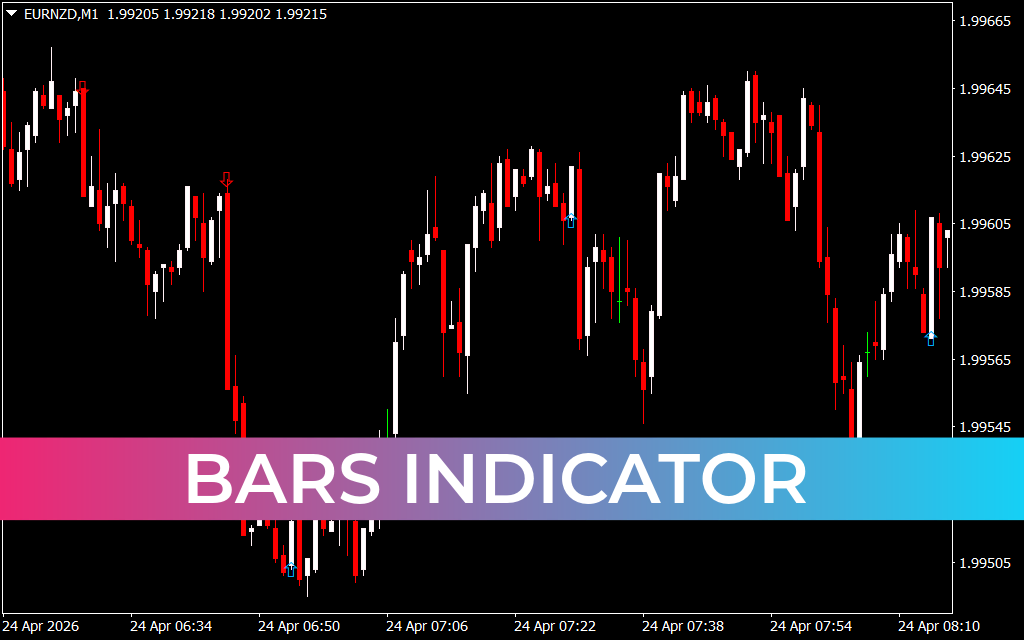
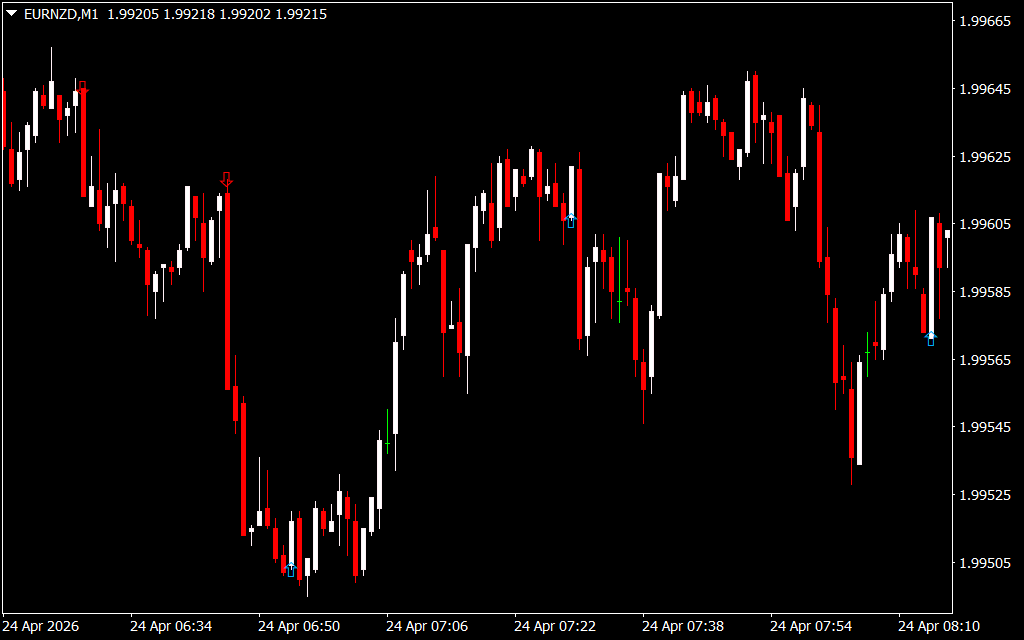
As demonstrated in the provided EURNZD H4 data, the indicator works by assigning specific colors to bars based on their momentum and relationship to previous price levels. Typically, a "red" bar indicates a period of bearish control, while a "white" or "green" bar suggests bullish dominance. This immediate visual feedback allows traders to identify trend continuations and potential reversals without manual calculation.
The Power of Visual Simplification
The primary benefit of the Bars Indicator is its ability to reduce "cognitive load." Professional traders know that "analysis paralysis" is a real threat. By using the Bars Indicator, you gain:
- Trend Clarity: The indicator filters out minor price fluctuations, ensuring that you stay on the right side of the primary trend.
- Volatilty Assessment: The vertical length of the bars, combined with the indicator's internal logic, provides a real-time measure of market volatility.
- Entry/Exit Precision: By identifying when a series of bars changes color, traders can pinpoint the exact moment momentum shifts, allowing for tighter stop-losses and more accurate entries.
Strategic Applications: From Scalping to Swing Trading
One of the most versatile aspects of the Bars Indicator is its performance across various timeframes. On a 1-minute (M1) chart, it acts as a high-speed noise filter for scalpers looking for quick momentum bursts. On a 4-hour (H4) or Daily chart, it becomes a powerful trend-following system that helps swing traders capture massive market moves.
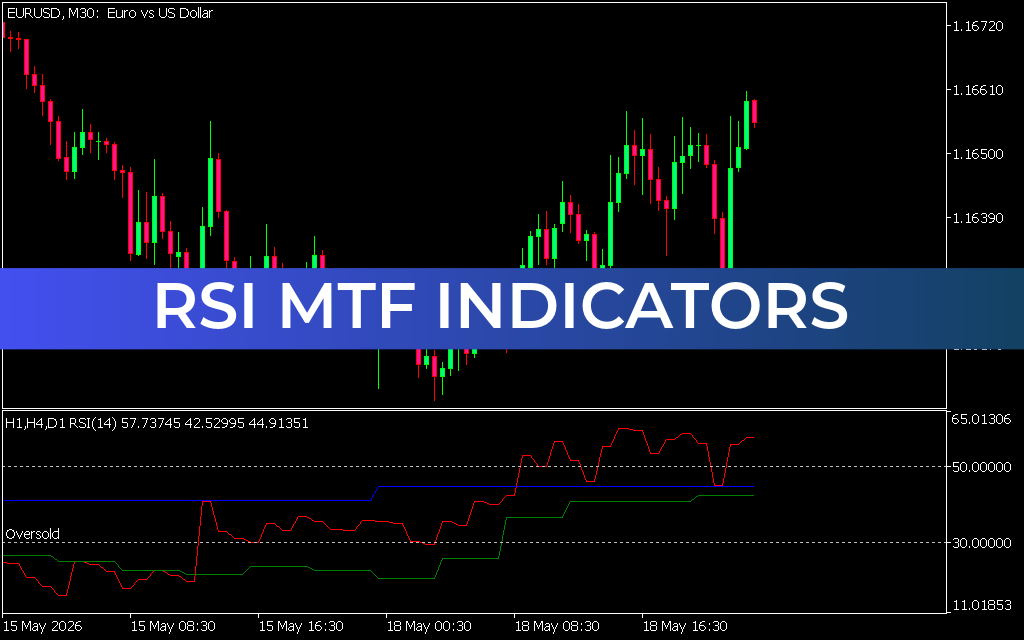
When paired with other technical tools—such as the Normalized Volume or StdDev indicators seen in the EURUSD and EURNZD datasets—the Bars Indicator becomes a core component of a high-probability trading system. For example, a color change in the Bars Indicator accompanied by a spike in normalized volume often marks the start of a significant new trend.
Conclusion
The Bars Indicator is an essential upgrade for any trader who values clarity and precision. By removing the visual clutter of standard charts and replacing it with a refined, color-coded system, it allows you to see the market for what it truly is: a series of momentum shifts. Whether you are navigating the rapid fluctuations of the Forex market or tracking long-term trends in commodities, the Bars Indicator provides the professional edge needed to succeed in 2026 and beyond.
5 Downloads
Last Update:
Apr 26, 2026 01:49 AM
Published:
Feb 02, 2026 02:44 AM
Category: