Master Market Pullbacks with the Auto Fibonacci Retracement Indicator
In the world of technical analysis, few tools carry as much weight as Fibonacci retracements. Based on mathematical ratios found throughout nature, these levels act as hidden Support And Resistance zones that institutional traders watch closely. However, manually drawing these grids can be subjective and time-consuming. Enter the Auto Fibonacci Retracement indicator—a game-changer for traders who demand precision and speed.
What is Auto Fibonacci Retracement?
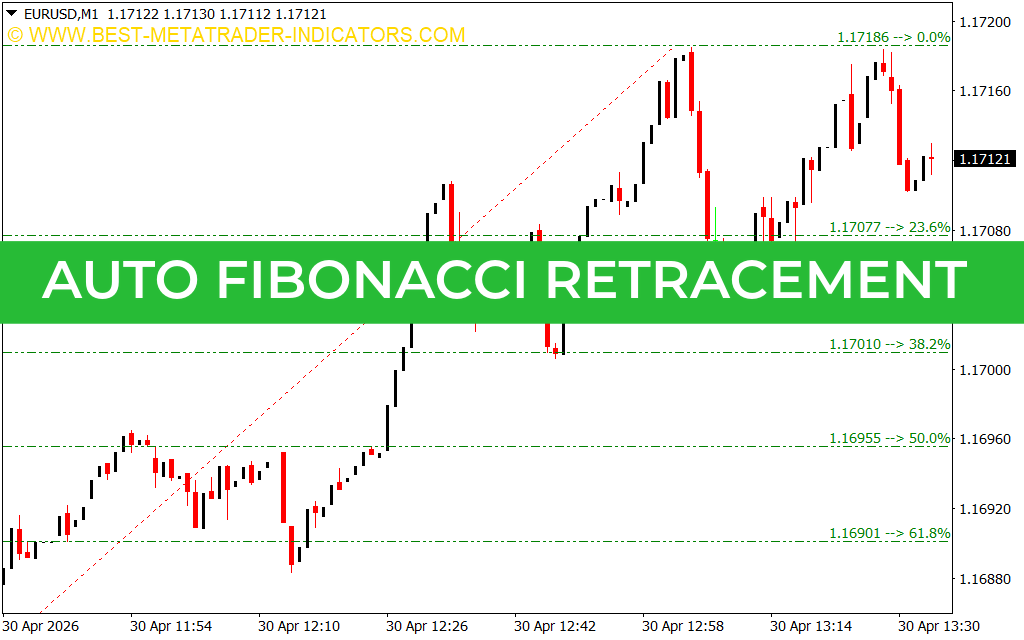
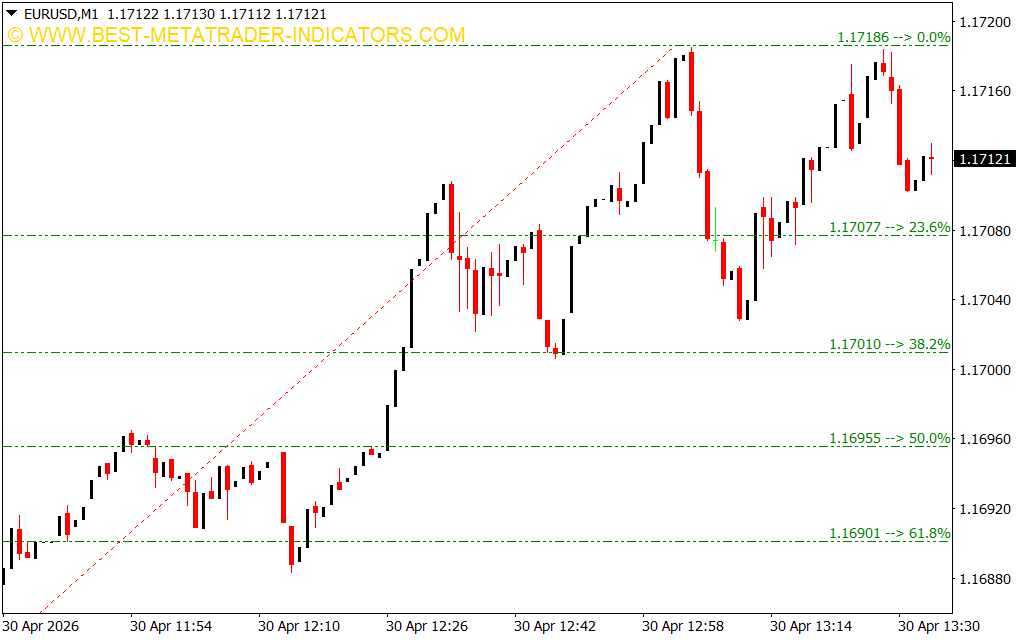
The Auto Fibonacci Retracement indicator is an advanced charting tool that automatically identifies significant high and low points in Price Action to plot Fibonacci levels. Instead of you guessing which "swing high" or "swing low" is the most relevant, the algorithm does the heavy lifting for you.
As demonstrated in the file EURUSDM1.png, the indicator identifies a major trend and instantly projects the key horizontal levels: 23.6%, 38.2%, 50.0%, and 61.8%. These lines represent potential areas where a trending market might "breathe" or pull back before continuing its original direction.
Why Use an Automated Fibonacci Tool?
- Eliminate Subjectivity: Two traders might draw manual Fibonacci lines differently. An automated tool ensures consistency in your technical setup every time you open a chart.
- Real-Time Adaptation: Markets move fast. As price creates a new peak or valley, the Auto Fibonacci indicator adjusts the levels dynamically, ensuring you are always looking at the most current data.
- Identify High-Probability Reversals: Markets rarely move in a straight line. By identifying the 50.0% and 61.8% "Golden Ratio" levels, you can find low-risk entry points during a trend retracement.
- Multi-Timeframe Efficiency: Whether you are Scalping the 1-minute chart shown in EURUSDM1.png or swing trading the daily, the indicator scales perfectly to suit your strategy.
Trading the "Golden Zone"
The most powerful way to use this indicator is to look for "confluence." When an automated Fibonacci level aligns with a previous support/resistance zone or a moving average, the probability of a price bounce increases.
For example, in a bullish trend, traders often wait for the price to dip toward the 38.2% or 50.0% levels. If the price shows signs of rejection at these levels—like long-wick candles—it provides a clear signal to enter a long position with a stop-loss just below the 61.8% mark.
Conclusion
Precision is the hallmark of a professional trader. By removing the guesswork from your charting, the Auto Fibonacci Retracement indicator allows you to focus on execution rather than calculation. It is an essential tool for anyone looking to capitalize on market pullbacks with mathematical accuracy.
5 Downloads
Last Update:
Apr 30, 2026 16:36 PM
Published:
Jan 30, 2026 19:15 PM
Category: