Master Volatility with the Adaptive Market Level Indicator
In the fast-paced world of Forex trading, static indicators often fall victim to the "lag trap." Standard moving averages and fixed support levels work beautifully in trending markets but fail miserably when volatility spikes or the market enters a consolidation phase. To navigate the EUR/USD and other major pairs effectively, traders need a tool that breathes with the market. Enter the Adaptive Market Level indicator.
What is the Adaptive Market Level?
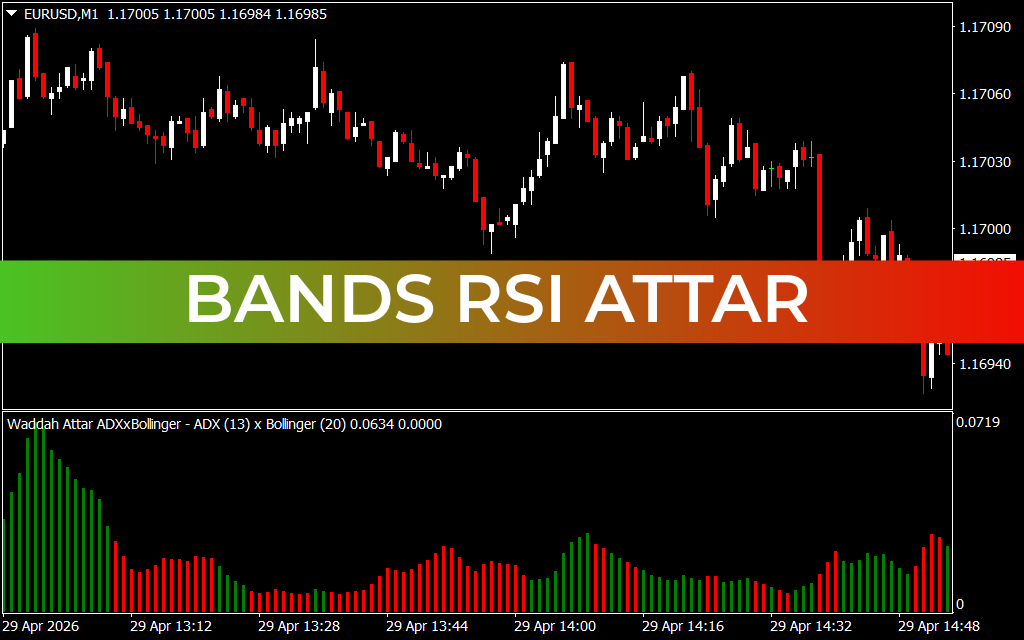
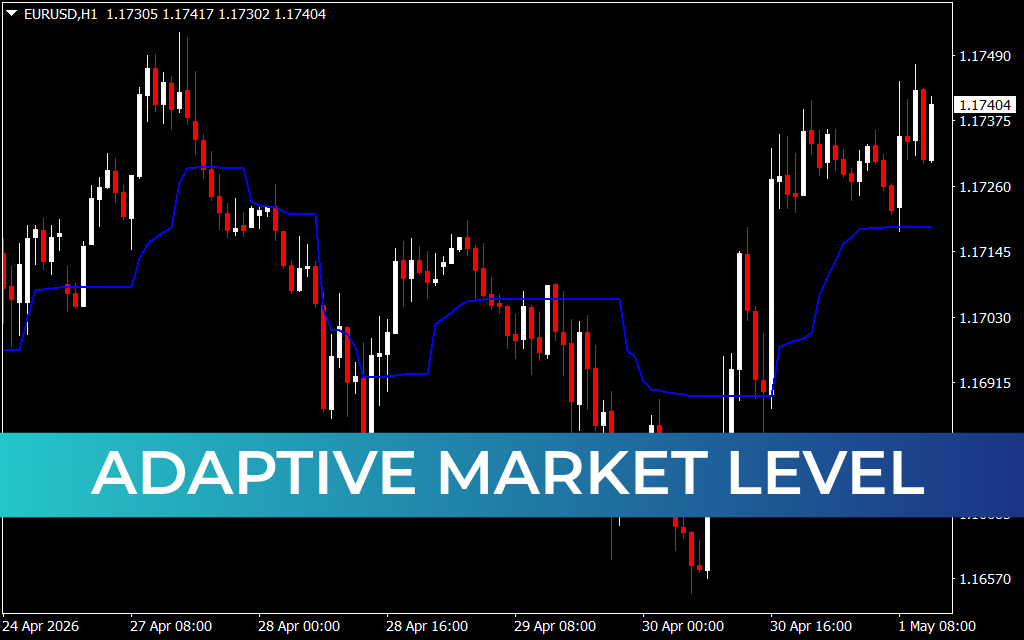
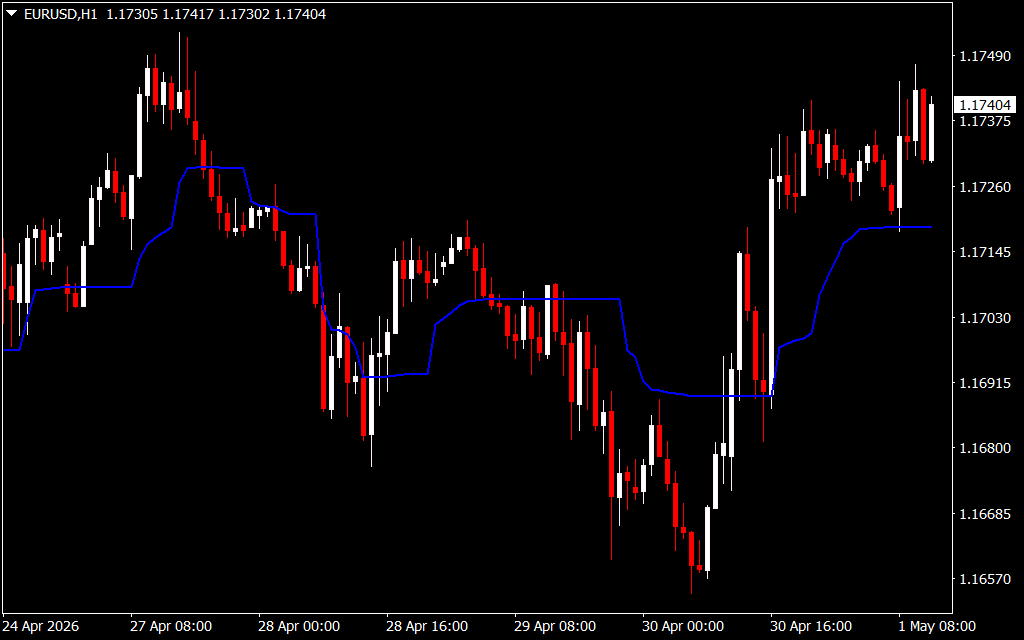
The Adaptive Market Level is a sophisticated technical analysis tool designed to identify the "true" equilibrium of Price Action. Unlike traditional lines that follow price blindly, this indicator uses a dynamic algorithm to filter out market noise. As seen in the H1 chart of the EUR/USD, the indicator appears as a stepped blue line that adjusts its sensitivity based on recent price range and volume.
When the market is moving aggressively, the level tracks closely to provide immediate support or resistance. During "sideways" price action, it flattens out, providing a reliable baseline that prevents traders from getting "chopped up" by minor fluctuations.
Key Benefits for Day Traders
- Noise Reduction: By using an adaptive smoothing constant, the indicator ignores the "wicks" and minor spikes that often trigger false signals in standard indicators.
- Trend Confirmation: When price stays consistently above the Adaptive Market Level, the bullish bias is confirmed. Conversely, price action below the line signals a dominant bearish sentiment.
- Dynamic Support And Resistance: The "stepped" nature of the line highlights specific price zones where the market has found a temporary balance, making it an excellent tool for setting stop-loss orders.
- Versatility: While highly effective on the H1 (Hourly) timeframe for intraday swings, it scales perfectly across M15 for Scalping or D1 for position trading.
Strategic Application
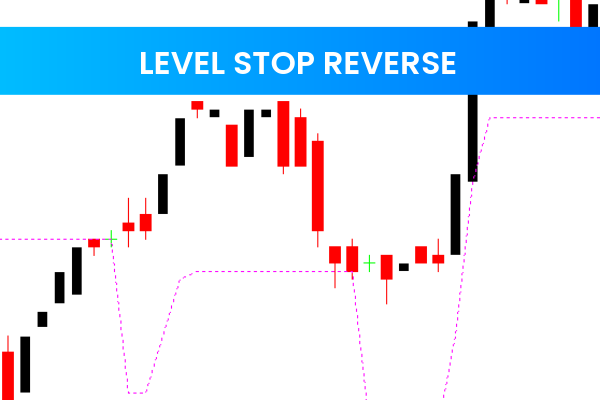
To get the most out of the Adaptive Market Level, look for confluence. In the provided EUR/USD chart, notice how the price recovered sharply on April 30th. A trader watching this indicator would have seen the price cross above the blue line and the line subsequently "step up." This shift serves as a mechanical signal that the short-term trend has reversed from bearish to bullish.
For risk management, the flat segments of the indicator act as natural "floors." Placing a stop-loss just below a flat adaptive level during a long trade provides a buffer based on actual Market Structure rather than an arbitrary number of pips.
2 Downloads
Last Update:
May 01, 2026 15:20 PM
Published:
Jan 29, 2026 18:34 PM
Category: