Decode Market Sentiment with the Ticks Separate Volume Indicator
In the decentralized world of Forex trading, traditional exchange volume is unavailable. Instead, savvy traders rely on "tick volume" to gauge market activity and intensity. However, standard volume bars only tell half the story. To truly understand who is in control—the bulls or the bears—you need a tool that deconstructs every price movement. The Ticks Separate Volume indicator is designed to do exactly that.
What is Ticks Separate Volume?
The Ticks Separate Volume indicator is an advanced technical analysis tool that splits tick data into its constituent parts: buying activity and selling activity. While a standard volume histogram shows the total number of price changes, this indicator reveals the hidden struggle within each candle.
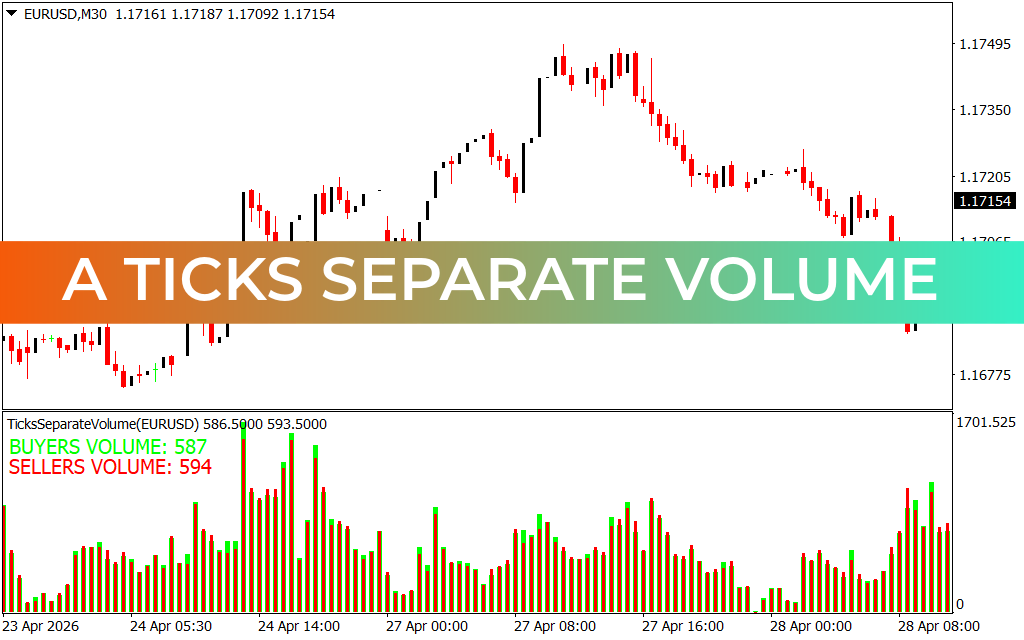
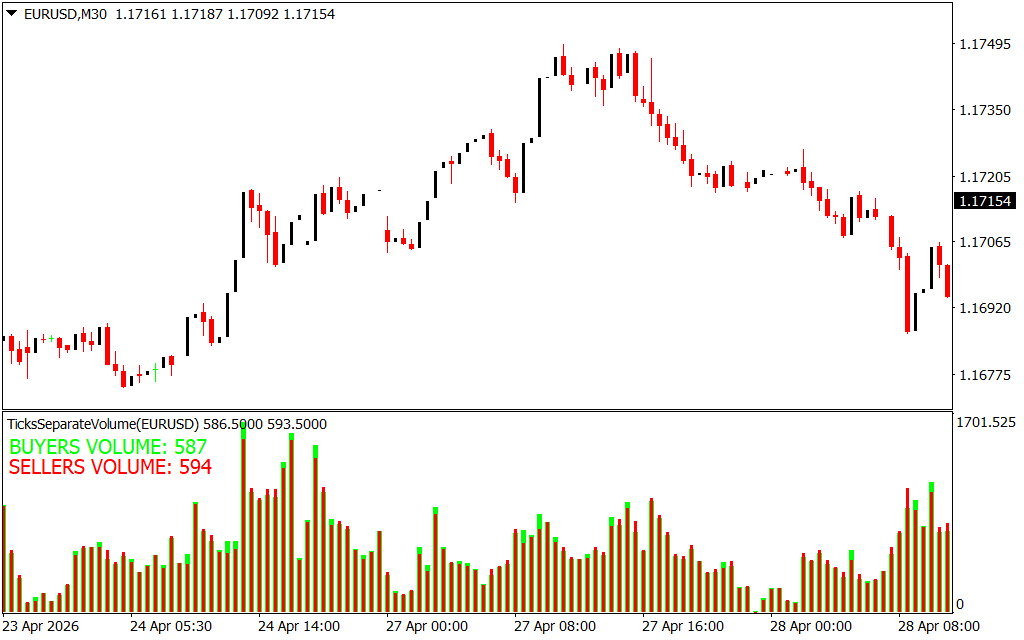
As shown in the provided chart, the indicator appears in a sub-window below the main Price Action. It displays two-tone histograms where green represents Buyers Volume and red represents Sellers Volume. This visual breakdown allows you to see instantly whether a price move is backed by aggressive buying or heavy selling pressure.
Why Volume Analysis is Critical for Traders
- Confirming Trend Strength: A price increase on rising buyer volume suggests a healthy uptrend. Conversely, if price rises while buyer volume fades, a reversal may be looming.
- Identifying Institutional Activity: Large spikes in the Ticks Separate Volume histogram often point to institutional participation or "smart money" entering the market.
- Spotting Divergences: When price hits a new high but the buyer volume shows a lower peak, it creates a bearish divergence—a powerful warning sign for traders.
- Precise Entry and Exit: By seeing the real-time balance of power, you can avoid entering trades during periods of low liquidity or "fakeouts."
How to Use Ticks Separate Volume in Your Strategy
One of the most effective ways to utilize this tool is by watching for "Volume Climaxes." When you see an exceptionally tall bar where one color significantly dominates the other, it often marks the exhaustion point of a trend.
For example, if you are monitoring a downtrend and a massive red bar appears followed by a shrinking sellers' volume and an increase in green buyers' volume, it indicates that the selling pressure is exhausted and a bullish correction is likely. Additionally, the indicator provides numerical values, such as Buyers Volume: 587 and Sellers Volume: 594, giving you the mathematical precision needed for data-driven decision-making.
Conclusion
The Ticks Separate Volume indicator is a must-have for any trader looking to move beyond basic price action. It provides the transparency needed to see through market noise and identify the true intent of participants. Whether you are a day trader or a scalper, adding this volume-splitting technology to your charts will give you a significant edge in identifying high-probability trade setups.
2 Downloads
Last Update:
Apr 30, 2026 16:43 PM
Published:
Jan 30, 2026 19:10 PM
Category: