Master Trend Direction with the 3EMA Crossover Histogram Indicator
In the competitive landscape of 2026 financial markets, traders require tools that simplify complex data into actionable signals. The 3EMA Crossover Histogram is a high-performance technical indicator for MetaTrader, designed to provide a definitive visual representation of trend momentum and directional shifts. By utilizing three distinct Exponential Moving Averages (EMAs), this indicator filters out market noise and highlights high-probability entry points with a clean, intuitive histogram interface.
The Logic of the Triple EMA System
Most traders are familiar with the standard dual moving average crossover. However, in volatile markets, two lines often produce "whipsaws"—false signals that lead to unnecessary losses. The 3EMA Crossover Histogram addresses this by incorporating a third "anchor" period. This triple-layered approach ensures that you only receive signals when short-term momentum, medium-term trend, and long-term structure are in total alignment.
The indicator calculates the interaction between:
- The Fast EMA: Captures immediate price fluctuations.
- The Medium EMA: Defines the localized trend direction.
- The Slow EMA: Acts as the institutional baseline for the trend.
Visualizing Momentum with the Histogram
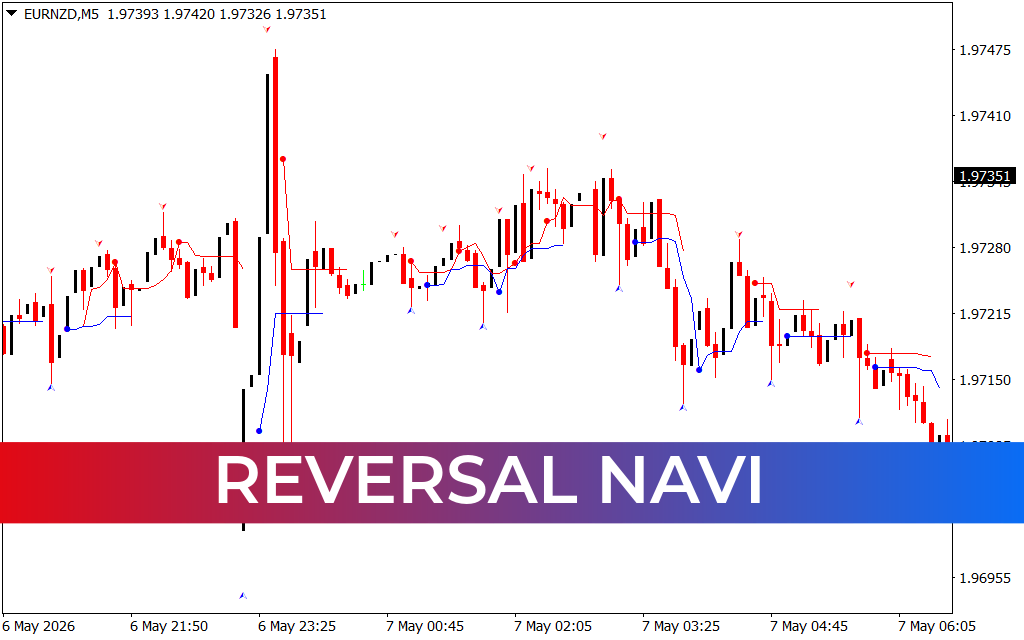
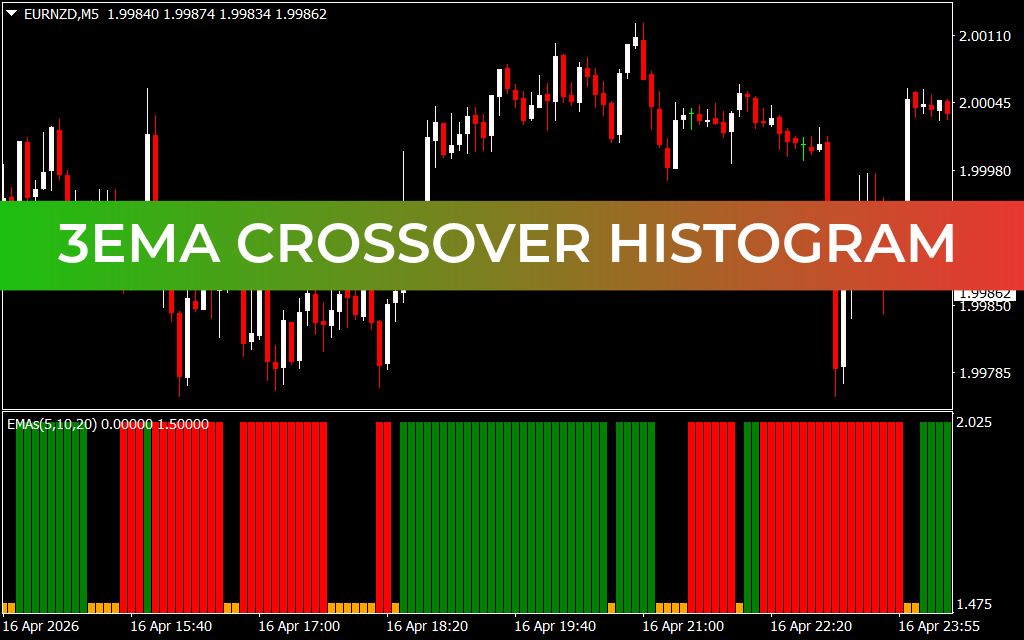
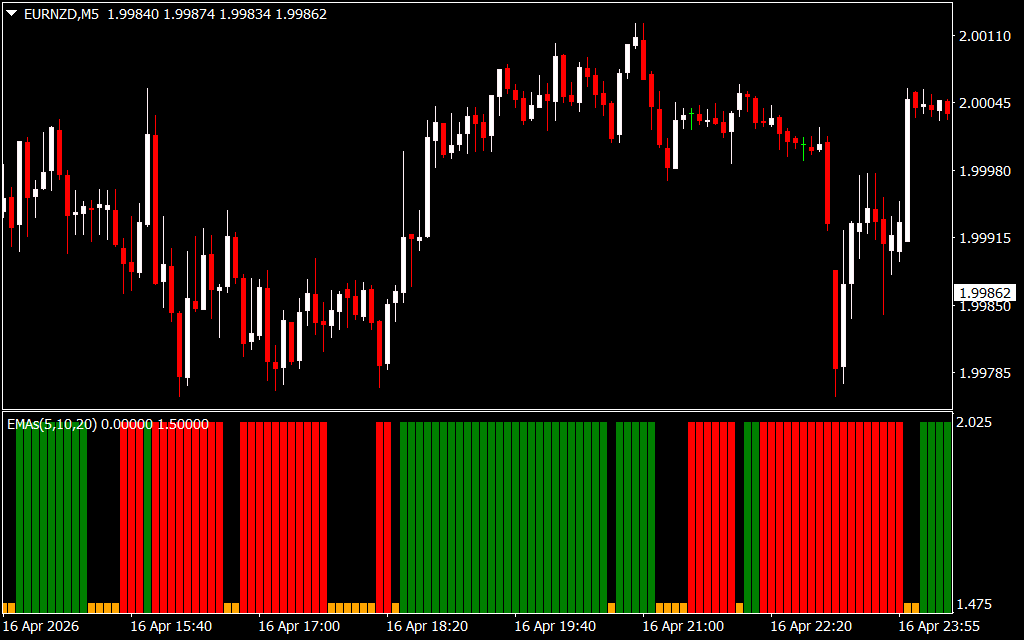
Instead of cluttering your main price chart with multiple overlapping lines, this indicator moves the analysis to a dedicated sub-window. As shown in the EURNZD 5-minute (M5) chart, the 3EMA Crossover Histogram uses a color-coded bar system to indicate market sentiment:
- Green Bars: When the bars are green and rising above the zero line, it signals strong bullish momentum. This indicates that the fast and medium EMAs have crossed above the slow anchor, confirming a buy-side opportunity.
- Red Bars: When the bars turn red and drop below the zero line, bearish momentum is in control. This represents a confirmed downward crossover, signaling a high-confidence sell entry.
- Yellow/Neutral Bars: Small bars near the zero line indicate a "squeeze" or consolidation phase, warning traders to stay on the sidelines until a clear breakout occurs.
Optimized for Day Trading and Scalping
The 3EMA Crossover Histogram is a favorite among intraday scalpers. Because it uses Exponential Moving Averages—which place a higher weight on recent price data—it reacts significantly faster than Simple Moving Average (SMA) indicators. On the M5 or M15 timeframes, this allows you to catch the beginning of a trend move before the "herd" arrives.
Professional Execution in 2026
Modern trading requires visual clarity. This indicator is perfectly optimized for professional dark mode trading setups. The high-contrast green and red bars ensure that you can read market sentiment at a glance, even during high-impact news events like central bank interest rate decisions or employment data releases.
Why Choose the 3EMA Crossover Histogram?
By moving the crossover logic into a histogram format, you free up your main chart for Price Action analysis, such as identifying support/resistance zones or candlestick patterns. This indicator provides the objective, data-driven confirmation needed to validate your trade ideas. Whether you are a beginner looking for a simple trend-following system or a professional seeking a reliable momentum filter, the 3EMA Crossover Histogram is an essential addition to your MetaTrader terminal.
5 Downloads
Last Update:
Apr 19, 2026 22:10 PM
Published:
Feb 03, 2026 17:35 PM
Category: